


 23 July 2014
2014- n° 167In the second quarter 2014, the demand addressed to the manufacturing industry has
deteriorated Quarterly business survey (goods-producing industries) - July 2014
23 July 2014
2014- n° 167In the second quarter 2014, the demand addressed to the manufacturing industry has
deteriorated Quarterly business survey (goods-producing industries) - July 2014
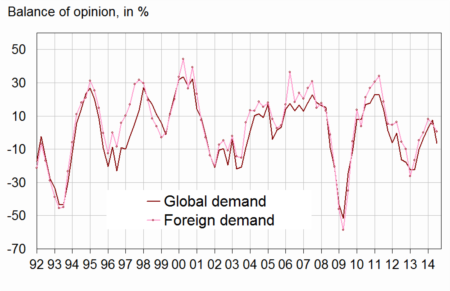
In the second quarter 2014, both global and foreign demand have deteriorated: the corresponding balances stand now below their long-term average. Over the three next months, the industrialists have anticipated a stability of global demand and a slightly increase of foreign demand, the balances remaining above their long-term average.
Demand
Deterioration of global and foreign demand
In the second quarter 2014, both global and foreign demand have deteriorated: the corresponding balances stand now below their long-term average. Over the three next months, the industrialists have anticipated a stability of global demand and a slightly increase of foreign demand, the balances remaining above their long-term average.
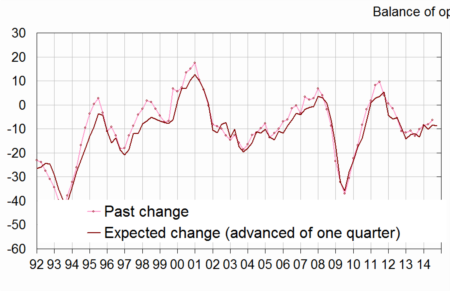
graphiqueGraphang1 – Past change in demand
Production factors
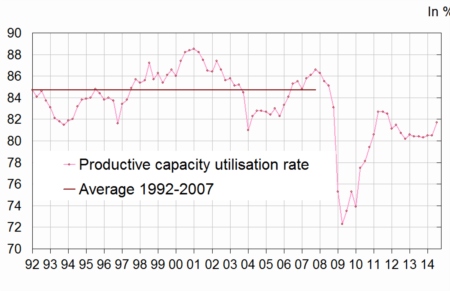
Increase of the tensions of the means of production
Over the second quarter 2014, the tensions of the means of production have increased. So the productive capacity utilization rate (TUC) has increased by two points compared to the previous quarter. But the TUC remains below its average level, indicating that there is still more underused capacities in the means of production than there were on average between 1992 and 2007 in the manufacturing industry. The balance on production bottlenecks is nearly stable at a level close to its long-term average.
graphiqueGraphang2 – Change in the productive capacity utilization rate
tableautableau1 – Industrialists' opinion : demand and production factors
| Manufacturing industry | Aver.* | Oct. 13 | Jan. 14 | April 14 | Jul. 14 |
|---|---|---|---|---|---|
| Global demand | |||||
| Past change | 0 | –3 | 3 | 7 | –6 |
| Future change | 1 | 2 | 4 | 5 | 4 |
| Foreign demand | |||||
| Past change | 3 | 0 | 8 | 5 | 1 |
| Future change | 4 | 10 | 12 | 7 | 10 |
| Production factors | |||||
| Production bottlenecks (in %) | 22 | 24 | 23 | 26 | 24 |
| Assessment of productive capacity | 14 | 16 | 10 | 12 | 16 |
| Productive capacity utilisation rate (in %) | 85 | 80 | 80 | 80 | 82 |
| Difficulties of supply and demand | |||||
| Difficulties of supply and demand | 8 | 11 | 11 | 12 | 13 |
| Difficulties of supply | 20 | 18 | 17 | 14 | 15 |
| Difficulties of demand | 44 | 46 | 49 | 47 | 40 |
- * : Long-term average.
- Source : Quarterly business survey - Insee
Workforce
A smaller decrease workforce size than on average
According to the business managers, the rate of job losses in the industry is slightly smaller over the last months compared to the previous quarter, the balance remains above its long-term average. Over the next months, industrialists consider that the change in workforce size is nearly unchanged : the corresponding balance remains above its long-term average .
The percentage of companies experiencing hiring difficulties in the manufacturing industry is stable and is very close to its long-term average.
graphiqueGraphang3 – Workforce size in the manufacturing industry
Wages and working time
According to the business managers in the manufacturing industry, the wages have increased by 0,4 % over the second quarter 2014.
The balance on the weekly working time is stable. There are slightly more industrialists which anticipate a reduction of this working time over the next months.
Cash-flow and selling prices
In the second quarter 2014, the proportion of industrialists experiencing cash-flow problems is nearly stable compared to the previous quarter and remains very close to its average level.
According to the business managers, the selling prices in the manufacturing industry have slightly gone down in the second quarter 2014. They forecast a stability in selling prices for the next quarter.
Competitive position
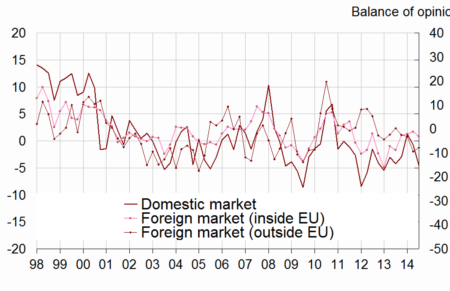
According to the industrialists, in the second quarter 2014, their competitive position remains deteriorated on foreign markets outside EU and have deteriorated on domestic market and on foreign markets inside. Each of the corresponding balances stands below its average level.
The general exportation expectations have sharply deteriorated : the corresponding balance has clearly decreased and is markedly below its long-term average.
graphiqueGraphang4 – Competitive position
tableautableau2 – Industrialists’ opinion : employment, competitive position, cash-flow, wags and selling prices
| Manufacturing industry | Aver.* | Oct. 13 | Jan. 14 | April 14 | Jul. 14 |
|---|---|---|---|---|---|
| Workforce size | |||||
| Past change | –11 | –10 | –9 | –8 | –6 |
| Expected change | –13 | –8 | –10 | –8 | –9 |
| Difficulties hiring | 28 | 28 | 26 | 27 | 27 |
| Working time | |||||
| Past change | –3 | 0 | 1 | –1 | –1 |
| Expected change | –5 | –2 | –2 | –1 | –3 |
| Cash-flow and wages | |||||
| Cash-flow problems | 15 | 14 | 13 | 13 | 14 |
| Past wages | 0,5 | 0,3 | 0,3 | 0,3 | 0,4 |
| Selling prices | |||||
| Past change | 0,2 | 0,2 | –0,5 | 0,0 | –0,1 |
| Expected change | 0,2 | –0,2 | 0,2 | –0,2 | 0,0 |
| Competitive position | |||||
| On domestic market | 1 | –3 | 1 | –1 | –5 |
| On foreign markets inside EU | –1 | –3 | –2 | –1 | –3 |
| On foreign markets outside EU | –1 | –3 | –3 | –9 | –8 |
| General exportation expectations | –11 | –9 | –14 | –10 | –24 |
- * : Long-term average.
- Source : Quarterly business survey - Insee
Documentation
Methodology (pdf,48 Ko)
Pour en savoir plus
Time series : Industry
