


 16 June 2015
2015- n° 147In May 2015, oil prices increased again Prices of oil and raw material imports - May 2015
16 June 2015
2015- n° 147In May 2015, oil prices increased again Prices of oil and raw material imports - May 2015
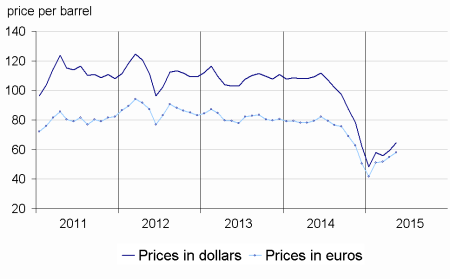
In May 2015, the price of crude oil in euros increased again (+5.4%), to average 57.9€ per barrel of Brent, which remained well below its level one year before (79.5€). Prices of imported commodities except energy in euros decreased again (–1.9%), either for raw food materials (-2.0%) or industrial raw materials (-1.9%).
In May 2015, the price of crude oil in euros increased again (+5.4%), to average 57.9€ per barrel of Brent, which remained well below its level one year before (79.5€). Prices of imported commodities except energy in euros decreased again (–1.9%), either for raw food materials (-2.0%) or industrial raw materials (-1.9%).
Oil prices in euros kept climbing
In May, the price of crude oil from the North Sea (Brent) in dollars accelerated (+8.7% after +6.5%), in particular as a result of the variation on the American market: the output ceased to increase and the volume of inventories decreased for the first time since the beginning of the year. In euros, the Brent price slowed a little (+5.4% after +6.4%), as the European currency appreciated against the dollar (+3.1%).
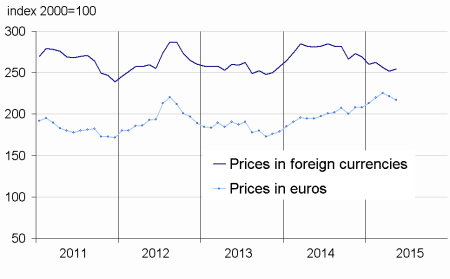
Prices of industrial raw materials dipped again
In May, prices of industrial raw materials in euros went down again (–1.9% after -0.5% in April), due to a drop in the prices of agricultural raw materials and minerals. Yet, year on year, prices increased (+9.9%), due to the depreciation of the euro since then.
The fall in agricultural raw materials prices eased (-3.4% after -4.2%), in particular those of sawn softwood (-4.7% after -8.7%). Prices of wood pulp kept dipping (-3.9% after –2.7%), while prices of natural fibers were at a standstill (–0.1% after +3.4%). On the other hand, prices of natural rubber accelerated (+5.8% after +0.3%).
Prices of minerals fell back (-1.4% after +0.8%), as a result of a decrease in prices of non-ferrous metals (-2.9% after +2.1%). In particular, lead prices plummeted (-10.6% after +17.5%). Prices of copper dropped as well (-5.5% after +3.2%), those of aluminum too (-3.4% after +2.3%). However, the prices of those two metals have increased sharply year-on-year (+8.8% and +27.1% respectively). Prices of precious metals also fell back (–3.1% after +1.9%), in particular those of palladium (–3.0% after +5.5%), and those of platinum (-6.0% after +0.2%). Prices of iron ore bounced back (+14.2% after –10.2%), big mining companies having shrunk their output because of delayed industrial projects.
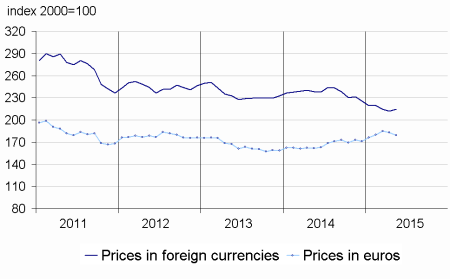
Prices of raw food materials declined virtually as much as in April
In May, prices of raw food materials continued to fall (–2.0% after -1.9%), in particular those of cereals (-6.0% after -2.2%), due to weakening trade, abundant stockpiles and favourable crop prospects. Prices of beef meat came down as well (-3.1% after -1.9%), in particular from the USA.
tableautabpetrole – Oil and petroleum products
| Prices | Change (%) | |||
|---|---|---|---|---|
| of last month | over the last month | over the last 3 months | over the last 12 months | |
| Brent in $ per barrel | 64.6 | 8.7 | 11.4 | –40.9 |
| Brent in € per barrel | 57.9 | 5.4 | 13.4 | –27.2 |
| Gasoline €/L | 0.46 | 8.7 | 24.5 | –15.2 |
| Gas Oil | 537.8 | 3.9 | 8.1 | –18.6 |
| Heavy fuel | 330.3 | –2.9 | 10.2 | –24.4 |
| Naphtha | 497.9 | 5.3 | 15.0 | –27.1 |
- Prices are in euros per tonne unless otherwise specified
- Source : INSEE
tableautabmatprem – Imported raw materials (excluding energy) in euros
| Index | Changes (%) | |||
|---|---|---|---|---|
| over the last month | over the last 3 months | over the last 12 months | ||
| Food total | 217.1 | –2.0 | –1.3 | 11.5 |
| Tropical foodstuffs | 210.4 | 1.4 | 1.7 | 21.6 |
| Oil seeds, vegetable oils | 232.5 | –3.1 | –4.1 | –5.8 |
| Cereals | 150.0 | –6.0 | –4.9 | 5.1 |
| Sugar | 127.5 | –4.7 | –10.9 | –10.6 |
| Beef meat | 184.9 | –3.1 | 1.1 | 37.9 |
| Industrial raw materials | 168.6 | –1.9 | 0.3 | 9.9 |
| Agricultural raw materials | 112.0 | –3.4 | –7.1 | 8.0 |
| Natural Fibers | 126.0 | –0.1 | 7.7 | –0.3 |
| Natural rubber | 178.3 | 5.8 | 9.1 | –0.8 |
| Hides | 98.6 | –5.8 | –5.5 | 8.4 |
| Wood pulp | 103.7 | –3.9 | –4.0 | 13.7 |
| Tropical wood | 115.5 | 0.3 | 2.7 | 13.0 |
| Sawn softwood | 82.7 | –4.7 | –17.4 | –8.2 |
| Minerals | 199.8 | –1.4 | 2.9 | 10.9 |
| Iron ore | 399.7 | 14.2 | –2.2 | –26.2 |
| Non-ferrous metals | 169.6 | –2.9 | 3.9 | 17.6 |
| Precious metals | 247.1 | –3.1 | –1.4 | 11.8 |
| All commodities | 179.4 | –1.9 | –0.4 | 10.8 |
- Source : INSEE
graphiqueG_petrole_ang – Oil (Brent)
- Source : INSEE
graphiqueG_alim_ang – Food
- Source : INSEE
graphiqueG_ensemble_ang – Imported raw materials (excluding energy)
- Source : INSEE
graphiqueG_indus_ang – Industrial raw materials

- Source : INSEE
Pour en savoir plus
Time series : Raw materials prices
