


 11 March 2015
2015- n° 55Virtual stability in payroll employment in Q4 2014 Payroll employment - 4th quarter 2014
11 March 2015
2015- n° 55Virtual stability in payroll employment in Q4 2014 Payroll employment - 4th quarter 2014
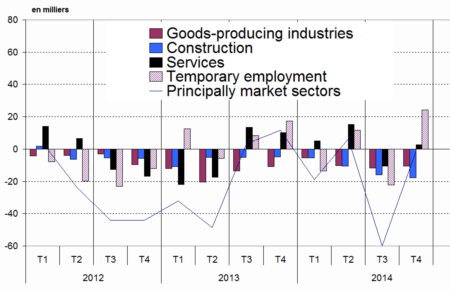
In Q4 2014, payroll employment in principally market sectors remained virtually stable (-1,300 jobs) after a strong decrease in the previous quarter (-0.4%, 59,900 jobs). Excluding temporary work, employment dropped in Q4 2014 (–25,400 jobs after -37,800 jobs in Q3 2014). Industry and construction continued to shrink in Q4 2014 (-0.3% and -1.3%).
In Q4 2014, payroll employment in principally market sectors remained virtually stable (-1,300 jobs) after a strong decrease in the previous quarter (-0.4%, 59,900 jobs). Excluding temporary work, employment dropped in Q4 2014 (–25,400 jobs after -37,800 jobs in Q3 2014). Industry and construction continued to shrink in Q4 2014 (-0.3% and -1.3%).
Sharp increase in temporary employment
Temporary employment rose sharply in Q4 2014: +4.7% (+24,100 jobs), after -4.1 % in Q3 2014 (-22,100 jobs).
Year-on-year, principally market sectors lost 74,000 jobs (-0,5%).
tableautableau_1 – Payroll employment change in the competitive sector : thousands …
| Change in 3 months | Change in 1 year | Level | ||
|---|---|---|---|---|
| 2014 | 2014 | 2014 | 2014 | |
| Q3 | Q4 | Q4 | Q4 | |
| Principally market sectors | –59.9 | –1.3 | –74.0 | 15,813.3 |
| Goods-producing industries excl. Construction | –11.6 | –10.4 | –37.7 | 3,141.3 |
| Manufacturing | –12.5 | –12.4 | –42.2 | 2,771.0 |
| Construction | –15.8 | –17.7 | –49.5 | 1,346.4 |
| Services | –32.5 | 26.8 | 13.1 | 11,325.6 |
| of which : Temporary employment | –22.1 | 24.1 | 0.3 | 542.1 |
| Principally non-market sectors (*) | 4.9 | 8.6 | 13.2 | 1,991.9 |
| Total competitive sector (*) | –55.0 | 7.3 | –60.8 | 17,805.2 |
tableautableau_2 – ... Percentage
| Change in 3 months | Change in 1 year | ||
|---|---|---|---|
| 2014 | 2014 | 2014 | |
| Q3 | Q4 | Q4 | |
| Principally market sectors | –0.4 | 0.0 | –0.5 |
| Goods-producing industries excl. Construction | –0.4 | –0.3 | –1.2 |
| Manufacturing | –0.4 | –0.4 | –1.5 |
| Construction | –1.1 | –1.3 | –3.5 |
| Services | –0.3 | 0.2 | 0.1 |
| of which : Temporary employment | –4.1 | 4.7 | 0.1 |
| Principally non-market sectors (*) | 0.2 | 0.4 | 0.7 |
| Total competitive sector (*) | –0.3 | 0.0 | –0.3 |
- (*) Excl. Agriculture and public employees in non-markets sectors (administration, health, education and social activity) ; na : not available
- Source : INSEE
tableautableau_4 – Payroll employment change in the competitive sector (*)
| Code | Change in 3 months | Change in 1 year | Level | ||
|---|---|---|---|---|---|
| Naf | 2014 | 2014 | 2014 | 2014 | |
| rev.2 | Q3 | Q4 | Q4 | Q4 | |
| DE | Electricity. gas. steam. and air conditioning supply ; water supply. sewerage. waste management and remediation activities | 0.9 | 2.0 | 4.5 | 370.3 |
| C1 | Manufacture of food products beverage and tobacco products | –0.7 | –0.7 | –1.2 | 543.5 |
| C2 | Manufacture of coke. and refined petroleum products | –0.1 | 0.0 | –0.1 | 9.7 |
| C3 | Manufacture of computer. electronic and electrical products; manufacture of machinery and equipment | –2.8 | –2.1 | –6.2 | 432.0 |
| C4 | Manufacture of transport equipment | –1.9 | –1.9 | –9.5 | 348.4 |
| C5 | Other manufacturing | –7.0 | –7.6 | –25.1 | 1,437.3 |
| FZ | Construction | –15.8 | –17.7 | –49.5 | 1,346.4 |
| GZ | Wholesale and retail trade ; repair of motor vehicles and motorcycles | –8.6 | –4.7 | –14.9 | 2,989.8 |
| HZ | Transportation and storage | –2.0 | –0.8 | –6.7 | 1,334.9 |
| IZ | Accommodation and food service activities | –2.7 | 1.4 | 7.1 | 980.3 |
| JZ | Information and communication | 1.8 | 4.7 | 6.4 | 712.8 |
| KZ | Financial and insurance activities | 1.9 | 1.4 | 4.5 | 844.6 |
| LZ | Real estate activities | –0.6 | –0.3 | –0.8 | 230.6 |
| MN | Professional. scientific and technical activities; administrative and support service activities | –21.9 | 28.5 | 18.3 | 2,960.6 |
| of which : Temporary employment | –22.1 | 24.1 | 0.3 | 542.1 | |
| OQ | Public administration and defence ; compulsory social security; education; human health and social work activities | 4.9 | 8.6 | 13.2 | 1,991.9 |
| RU | Other service activities | –0.4 | –3.3 | –0.7 | 1,272.0 |
- (*) Excl. Agriculture and public employees in non-markets sectors (administration. health. education and social activity)
- Source : INSEE
graphiqueGraph2 – Evolution of principally market sectors
Documentation
Methodology (pdf,135 Ko)
Pour en savoir plus
