


 27 August 2015
2015- n° 205In August 2015, the business climate remains over its average in the retail trade
and in the trade and repair of motor vehicles Monthly survey of retailing - August 2015
27 August 2015
2015- n° 205In August 2015, the business climate remains over its average in the retail trade
and in the trade and repair of motor vehicles Monthly survey of retailing - August 2015
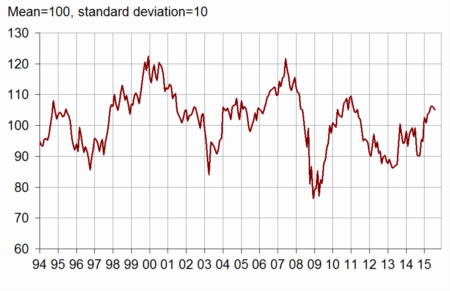
According to the managers surveyed in August 2015, the business climate remains over its average in the retail trade and in the trade and repair of motor vehicles. The corresponding synthetic indicator is virtually stable (–1 point) and has stayed over its long term average since the beginning of the year.
According to the managers surveyed in August 2015, the business climate remains over its average in the retail trade and in the trade and repair of motor vehicles. The corresponding synthetic indicator is virtually stable (–1 point) and has stayed over its long term average since the beginning of the year.
graphiquegraph_indsynt_en – Business climate synthetic indicator
Past sales on the rise
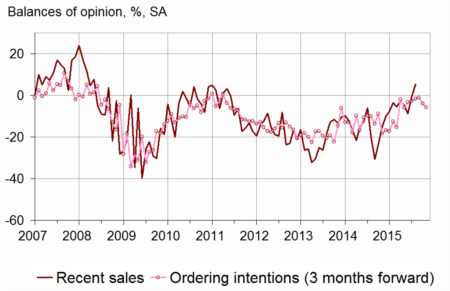
According to the managers in retail trade and in trade and repair of motor vehicles, past sales have advanced again: the corresponding balance has reached its highest point since mid-2008. This progress owes to the retail trade as well to the motor vehicles trade. The business leaders are more and more optimistic about the general business outlook of the sector: the balance has increased for six months in a row. However, they have been more reserved about their own prospects: each of the two balances concerning expected sales and ordering intentions has declined but has remained over its average.
Stocks have been estimated lower, below their standard level from now on.
Slightly more business leaders than in July expect lower prices over the next few months.
graphiqueGraph_ventes_ic_en – Recent sales and ordering intentions
tableautab1_en – Global data
| Ave. (1) | Mai 15 | June 15 | July 15 | Aug. 15 | |
|---|---|---|---|---|---|
| Business climate | 100 | 106 | 106 | 106 | 105 |
| General business outlook | –30 | –24 | –22 | –21 | –18 |
| Recent sales | –7 | –5 | –9 | –1 | 5 |
| Expected sales | –3 | 6 | –1 | 5 | –2 |
| Ordering intentions | –9 | –2 | –1 | –4 | –6 |
| Stocks | 10 | 3 | 9 | 10 | 7 |
| Past selling prices (2) | –6 | –7 | –10 | ||
| Expected selling prices | –3 | –8 | –4 | –6 | –8 |
| Cash position (2) | –15 | –18 | –18 | ||
| Workforce size: recent trend | 0 | –1 | –1 | 0 | –4 |
| Workforce size: future trend | –3 | –4 | –4 | –4 | –7 |
- (1) Average since 1991 (2004 for recent and expected sales and ordering intentions).
- (2) Bi-monthly question (odd-numbered months).
- Source: monthly survey in the retail trade and in the trade and repair of motor vehicles - INSEE
Slightly more pessimism about employment
Each of both balances concerning recent and future trends on workforce size has slightly decreased, falling below its average.
Retail trade
Past activity estimed better
More retailers than in July have declared an increase in their past sales, the corresponding balance being now above its average, in non-specialised as in specialised trade.
Retailers have been overall less optimistic about their forecasts: each of both balances concerning expected sales and ordering intentions has slightly declined, but has remained over its mean level.
In the whole retail trade, stocks are estimated lower, still below their standard level.
More retailers than in July expect price falls on the next few months, especially in non-specialised trade.
Trade and repair of motor vehicles
Very dynamic past activity
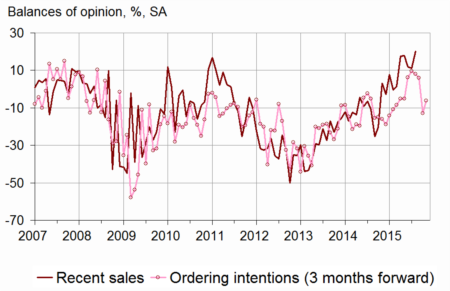
In the trade and repair of motor vehicles, past activity has soared: the corresponding balance has never been so high since the start of the survey (2003).
Over the next few months, the motor vehicles traders’ opinion is less firm: the expected sales balance has decreased while the ordering intentions one has risen. Each of the two is over its long term average.
graphiquegraph_ventes_ic_auto_en – Recent sales and ordering intentions in motor vehicles
Stocks have been estimated lower, still under their standard level.
As many managers as in July expect price falls over the next few months.
tableautab2_en – Detailed data
| Ave. (1) | Mai 15 | June 15 | July 15 | Aug. 15 | |
|---|---|---|---|---|---|
| Retail trade - Global data | |||||
| Recent sales | –6 | –14 | –17 | –6 | –1 |
| Expected sales | –1 | 6 | –2 | 5 | 0 |
| Ordering intentions | –7 | –3 | –5 | –4 | –6 |
| Stocks | 10 | 0 | 9 | 9 | 7 |
| Past selling prices (2) | –8 | –12 | –13 | ||
| Expected selling prices | –5 | –12 | –7 | –9 | –12 |
| Cash position (2) | –13 | –18 | –17 | ||
| Workforce size: recent trend | 1 | –1 | 0 | 2 | –3 |
| Workforce size: future trend | –2 | –5 | –5 | –4 | –9 |
| Non-specialised retail trade | |||||
| Recent sales | –2 | –5 | –18 | –2 | 2 |
| Expected sales | 5 | 17 | 7 | 10 | 8 |
| Ordering intentions | 1 | 9 | 4 | 5 | 3 |
| Stocks | 7 | –9 | 4 | 4 | 5 |
| Past selling prices (2) | –8 | –11 | –10 | ||
| Expected selling prices | –5 | –13 | –7 | –5 | –10 |
| Cash position (2) | –7 | –12 | –13 | ||
| Specialised retail trade | |||||
| Recent sales | –11 | –25 | –16 | –10 | –4 |
| Expected sales | –8 | –8 | –12 | –5 | –7 |
| Ordering intentions | –17 | –20 | –12 | –13 | –13 |
| Stocks | 14 | 12 | 14 | 16 | 11 |
| Past selling prices (2) | –8 | –16 | –16 | ||
| Expected selling prices | –5 | –12 | –9 | –13 | –14 |
| Cash position (2) | –22 | –25 | –22 | ||
| Trade and repair of motor cars and motorcycles | |||||
| Recent sales | –10 | 18 | 12 | 11 | 20 |
| Expected sales | –9 | 5 | 3 | 3 | –4 |
| Ordering intentions | –13 | 8 | 6 | –13 | –6 |
| Stocks | 15 | 10 | 10 | 12 | 8 |
| Past selling prices (2) | 1 | 4 | 0 | ||
| Expected selling prices | 4 | 3 | 5 | 2 | 2 |
| Cash position (2) | –25 | –15 | –15 | ||
| Workforce size: recent trend | –9 | 0 | –4 | –10 | –7 |
| Workforce size: future trend | –7 | 0 | –1 | –3 | –1 |
- (1) Average since 1991 (2003 for trade and repair of motor vehicles and 2004 for recent and expected sales and ordering intentions).
- (2) Bi-monthly question (odd-numbered months).
- Source: monthly survey in the retail trade and in the trade and repair of motor vehicles - INSEE
Documentation
Methodology (pdf,129 Ko)
Pour en savoir plus
