


 20 October 2014
2014- n° 238In September 2014, oil prices kept decreasing Prices of oil and raw material imports - September 2014
20 October 2014
2014- n° 238In September 2014, oil prices kept decreasing Prices of oil and raw material imports - September 2014
In September 2014, the price of crude oil in euro terms continued to decline (-1.5%) and averaged €75.5 per barrel of Brent. Prices of imported commodities except energy in euros continued to climb at the same rate as in August (+1.1%), supported by the increase in raw food materials prices (+2.8%).
In September 2014, the price of crude oil in euro terms continued to decline (-1.5%) and averaged €75.5 per barrel of Brent. Prices of imported commodities except energy in euros continued to climb at the same rate as in August (+1.1%), supported by the increase in raw food materials prices (+2.8%).
Oil prices kept dropping
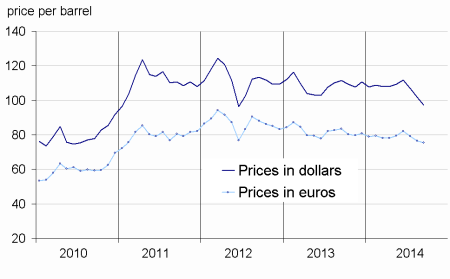
In September, the price of crude oil from the North Sea (Brent) in dollars kept dropping (-4.5% after -4.7%), as a result of an increased supply in Libya and in Iraq. In euros, the Brent price dropped less sharply (-1.5% after -3.3%). However, it reached its lowest level since February 2011.
Prices of industrial raw materials fell
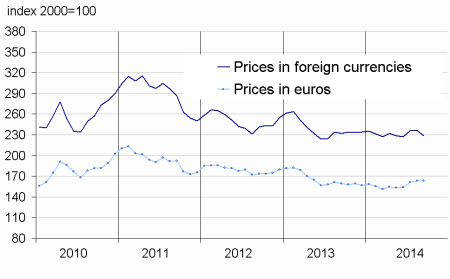
In September, prices of industrial raw materials in euros went down slightly (-0.2% after +1.4% in August). Prices of agricultural raw materials increased (+2.2% after +2.1%), due to a surge in wood pulp prices (+3.4% after +1.7%), as a result of the seasonal recovery in paper and cardboard demand facing weak stocks. Prices of natural fibers picked up (+2.1% from -9.3%), in particular those of cotton, in conjunction with the cut in worldwide subsidies in the sector and despite the abundant summer’s crops in Western Africa. Prices of natural rubber dipped sharply (-3.2% from -0.3%), as a result of a continuous oversupply in Thailand and in Indonesia. Prices of minerals decreased (–1.0% after +1.2%). Prices of non-ferrous metals slowed down (+0.7% after +2.0%). Prices of nickel, in particular, barely rose (+0.3% from -1.0%), and prices of zinc decelerated (+1.5% after +2.4%). Prices of lead plunged (–4.9% from +2.5%), on account of a lessening world’s demand. Prices of precious metals dipped sharply (–4.2% after -0.6%), in particular those of gold (-1.7% from +0.3%). Once again, prices of iron ore decreased markedly (-8.3% after –2.1%) due to a lower-than-expected Chinese demand.
Prices of raw food materials continued to rise
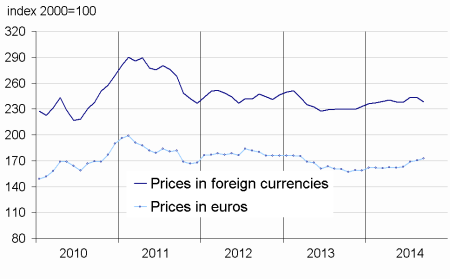
In September, the price rise in raw food materials in euros accelerated (+2.8% after +0.6%), boosted by oil seeds and vegetable oils (+6.3% after +4.8%). Prices of tropical foodstuffs slowed down (+2.2% after +4.6%), on account of a slight rise in arabica prices (+2.1% after +11.2%) and tea (+1.9% after +3.0%). Because of the high level of worldwide stocks, prices of cereals slowed down as well (+0.3% from +1.3%).
tableautabpetrole – Oil and petroleum products
| Prices | Change (%) | |||
|---|---|---|---|---|
| of last month | over the last month | over the last 3 months | over the last 12 months | |
| Brent in ($/barrel) | 97.3 | –4.5 | –13.0 | –12.8 |
| Brent in (€/barrel) | 75.5 | –1.5 | –8.3 | –9.7 |
| Gasoline (€/L) | 0.53 | –0.7 | –6.3 | 1.2 |
| Gas Oil (€/ton) | 645.3 | –1.3 | –3,8 | –8.1 |
| Heavy fuel (€/ton) | 438.4 | –1.1 | –3.3 | –4.6 |
| Naphtha (€/ton) | 658.1 | 0.7 | –6.1 | –5.4 |
- Prices are in euros per tonne unless otherwise specified
- Source: Insee
tableautabmatprem – Imported raw materials (excluding energy) in euros
| Index | Changes (%) | |||
|---|---|---|---|---|
| over the last month | over the last 3 months | over the last 12 months | ||
| Food total | 207.8 | 2.8 | 5.3 | 15.5 |
| Tropical foodstuffs | 193.9 | 2.2 | 9.1 | 34.1 |
| Oil seeds. vegetable oils | 257.2 | 6.3 | 5.8 | 6.2 |
| Cereals | 140.0 | 0.3 | –1.1 | –12.1 |
| Sugar | 126.7 | –5.3 | –10.7 | –11.3 |
| Beef meat | 148.5 | –0.4 | 4.2 | 31.7 |
| Industrial raw materials | 163.1 | –0.2 | 6.1 | 2.2 |
| Agricultural raw materials | 110.8 | 2.2 | 7.5 | 5.2 |
| Natural Fibers | 108.5 | 2.1 | –13.2 | –14.6 |
| Natural rubber | 175.6 | –3.2 | –3.8 | –33.3 |
| Hides | 101.8 | 5.3 | 11.5 | 29.4 |
| Wood pulp | 97.9 | 3.4 | 6.1 | 11.4 |
| Tropical wood | 105.4 | 0.7 | 1.7 | 6.4 |
| Sawn softwood | 99.7 | 1.7 | 16.4 | 7.2 |
| Minerals | 191.2 | –1.0 | 5.5 | 1.1 |
| Iron ore | 472.8 | –8.3 | –6.4 | –36.4 |
| Non-ferrous metals | 160.0 | 0.7 | 8.7 | 13.5 |
| Precious metals | 221.5 | –4.2 | –1.8 | –5.9 |
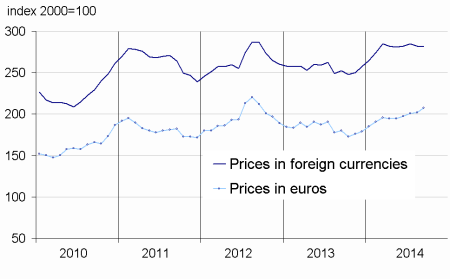
| All commodities | 172.3 | 1.1 | 5.7 | 7.4 |
- Source: Insee
graphiqueG_petrole_ang – Oil
- Source: Insee
graphiqueG_alim_ang – Food
- Source: Insee
graphiqueG_ensemble_ang – All commodities
- Source: Insee
graphiqueG_indus_ang – Industrial raw materials
- Source: Insee
Pour en savoir plus
Time series : Raw materials prices
