


 30 June 2014
2014- n° 156In April 2014, the sales volume increased in accommodation and food services activities
and in trade and repair of motor vehicles Sales volume in the retail trade and personal services - April 2014
30 June 2014
2014- n° 156In April 2014, the sales volume increased in accommodation and food services activities
and in trade and repair of motor vehicles Sales volume in the retail trade and personal services - April 2014
In April 2014, the sales volume rose in accommodation and food service activities (+1.5%) and in trade and repair of motor vehicles and motorcycles (+0.7%). It was almost stable in the retail trade, except for motor vehicles and motorcycles (+0.1%). On the contrary, it declined in household services. (–1.0%).

Except for indices from Emagsa survey, every index in this issue is in volume and seasonally and working-day adjusted (SA-WDA).
The commentary shows variations of subsections by decreasing contribution. The contribution of a subsection depends on the extent of the change and on its weight.
In April 2014, the sales volume rose in accommodation and food service activities (+1.5%) and in trade and repair of motor vehicles and motorcycles (+0.7%). It was almost stable in the retail trade, except for motor vehicles and motorcycles (+0.1%). On the contrary, it declined in household services. (–1.0%).
graphiqueGraph1_Anglais – Volume of sales in the retail trade and personal services
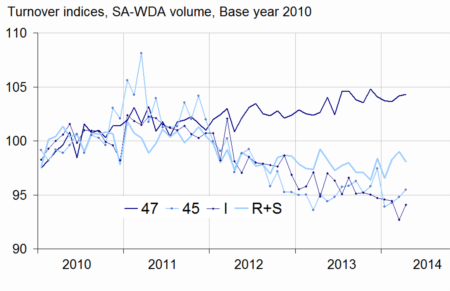
- Source : INSEE
Near-stability in the retail trade except for motor vehicles and motorcycles
In April, sales volume in retail trade except for motor vehicles and motorcycles was almost steady.(+0.1%) after a rise in March (+0.5%). In May, the sales volume is expected to edge up by +0.8%.
Sales volume rose in non specialised stores (+0.4%). Though it was stable in specialised stores, it increased significantly in retail sale of food, beverages…(+3.6%) and in retail sale of information and communication equipment (+3.1%) but it declined in retail sales of other goods (such as clothing, pharmaceuticals…) (–0.9%) and in retail sale of other household equipment (–1.2%).
Over the last three months (q-o-q), the sales volume declined slightly in the retail trade, except for motor vehicles and motorcycles (–0.2%) but increased year on year (+1.5%).
tableauTab1_anglais – Variation of sales volume in the retail trade and personal services
| Change in % | |||||
|---|---|---|---|---|---|
| NACE Classification | Weight | April/ March | March/ Feb. | q-o-q (1) | y-o-y (2) |
| 47 Retail trade, except for motor vehicles and motorcycles | 1000 | 0.1 | 0.5 | –0.2 | 1.5 |
| 471 Retail sale in non-specialized stores | 369 | 0.4 | –0.3 | –0.4 | –1.2 |
| 472 to 477 Retail sale in specialized stores | 573 | 0.0 | 1.0 | 0.1 | 3.3 |
| 478 and 479 Retail trade not in stores | 58 | –0.4 | 0.5 | –1.7 | 0.1 |
| 45 Trade and repair of motor vehicles and motorcycles | 1000 | 0.7 | 0.6 | –0.9 | 0.3 |
| I Accommodation and food service activities | 1000 | 1.5 | –1.8 | –1.1 | –2.3 |
| R+S Household services | 1000 | –1.0 | 0.8 | 1.4 | 0.4 |
| R Arts, entertainment and recreation | 449 | –1.0 | 1.1 | 1.7 | 0.0 |
| S Other service activities | 551 | –1.0 | 0.5 | 1.1 | 0.8 |
- (1) Quarter-on-quarter: last three months / previous three months.
- (2) Year-on-year: last three months / same three months of the previous year.
- The codes correspond to different levels of aggregation of the classification NAF rev.2
- Source: INSEE
tableauTabprecoce_anglais – Variation of sales volume in the retail trade : early estimate*
| Change in % | ||
|---|---|---|
| May 2014/ April 2014 | May 2014/ May 2013 | |
| 47 Retail trade, except for motor vehicles and motorcycles | 0,8 | 1,0 |
- * Econometric estimate from a set of sources available within 30 days after the end of the reference month
- Source: INSEE
Third rise in a row in trade and repair of motor vehicles and motorcycles
Sales volume in trade and repair of motor vehicles and motorcycles went on growing for the third month (+0.7% after +0.6% in March and +0.4% in February). It increased again in the sale of motor vehicles (+0.9%) and rebounded in maintenance and repair of motor vehicles (+2.0%).
The sales volume declined over the last three months (–0.9%) and improved slightly year on year (+0.3%).
tableauTab2_anglais – Variation of sales volume in the retail trade and personal services
| Change in % | |||||
|---|---|---|---|---|---|
| Nace Classification | Weight | April 2014 | April/March | March/Feb. | q-o-q (1) |
| 47 Retail trade, except for motor vehicles and motorcycles | 1000 | 104.3 | 0.1 | 0.5 | –0.2 |
| 471 Non-specialised stores | 369 | 99.1 | 0.4 | –0.3 | –0.4 |
| 472 à 477 Specialised stores | 573 | 107.8 | 0.0 | 1.0 | 0.1 |
| 472 Retail sale of food, beverages and tobacco in specialised stores | 49 | 103.2 | 3.6 | –2.7 | –0.3 |
| 473 Retail sale of automotive fuel | 78 | 98.5 | 1.1 | 4.3 | –1.6 |
| 474 Retail sale of information and communication equipment | 28 | 143.1 | 3.1 | –1.1 | 0.2 |
| 475 Retail sale of other household equipment | 112 | 98.9 | –1.2 | 0.1 | –0.6 |
| 476 Retail sale of cultural and recreation goods | 48 | 100.8 | 0.2 | 0.0 | 0.9 |
| 477 Retail sale of other goods in specialised stores | 258 | 112.9 | –0.9 | 1.6 | 0.8 |
| 478 et 479 Retail trade not in stores | 58 | 102.8 | –0.4 | 0.5 | –1.7 |
| 45 Wholesale and retail trade and repair of motor vehicles and motorcycles | 1000 | 95.5 | 0.7 | 0.6 | –0.9 |
| 451 Sale of motor vehicles | 671 | 93.8 | 0.9 | 0.7 | –1.4 |
| 452 Maintenance and repair of motor vehicles | 78 | 92.4 | 2.0 | –1.0 | –0.6 |
| 453 Sale of motor vehicle parts and accessories | 227 | 102.2 | 0.1 | 0.6 | 0.2 |
| 454 Sale, maintenance and repair of motorcycles and related parts and accessories | 24 | 90.3 | –0.8 | 1.4 | 1.0 |
| I Accommodation and food service activities | 1000 | 94.1 | 1.5 | –1.8 | –1.1 |
| 55 Accommodation | 255 | 96.4 | 4.6 | –4.9 | –1.8 |
| 56 Food and beverage service activities | 745 | 93.3 | 0.4 | –0.8 | –0.9 |
| 561 Restaurants… | 549 | 92.0 | –0.1 | –0.5 | –1.3 |
| 562 Event catering… | 116 | 101.9 | 2.0 | –1.8 | 0.6 |
| 563 Beverage serving activities | 80 | 89.4 | 1.3 | –0.9 | 0.0 |
| R+S Household services | 1000 | 98.1 | –1.0 | 0.8 | 1.4 |
| R Arts, entertainment and recreation | 449 | 97.5 | –1.0 | 1.1 | 1.7 |
| 90 Creative, arts and entertainment activities | 115 | 95.8 | –3.7 | 1.6 | 1.2 |
| 91 Libraries, archives, museums… | 11 | 107.8 | –1.7 | 1.6 | 5.8 |
| 92 Gambling and betting activities | 119 | 106.2 | –0.4 | 2.3 | 4.7 |
| 93 Sports activities and amusement... | 204 | 92.9 | 0.3 | 0.1 | –0.1 |
| S Other service activities | 551 | 98.5 | –1.0 | 0.5 | 1.1 |
| 95 Repair of computers… | 228 | 100.1 | –2.7 | 1.9 | 3.1 |
| 96 Other personal service activities | 323 | 97.4 | 0.3 | –0.5 | –0.3 |
- (1) Quarter-on-quarter: last three months / previous three months.
- Source: Insee
Rebound in accommodation and food service activities
Sales volume in accommodation and food service activities bounced back in April (+1.5%) after a notable decline in March (–1.8%). It soared in accommodation (+4.6%) and to a lesser extent in event catering and other food services (+2.0%). It levelled off in restaurants and fast food services (–0.1%).
The sales volume of the whole sector declined over the last three months (–1.1%) and year on year (–2.3%).
Decrease in household services
Sales volume in household services was down in April (–1.0%) after two months of growth. It declined significantly in repair of computers and personal and household goods (–2.7%), in creative, arts and entertainment activities (–3.7%) and more slightly in gambling and betting activities (–0.4%).
The sales volume in household services increased over the last three months (+1.4%) and year on year (+0.4%).
Revisions
Changes for March were revised by –0.3 point in accommodation and food service activities. The other sectors remained unchanged.
Monthly survey onlarge-scale food retailing
Turnover in large-scale food retailing rose moderately in May (+0.8%). However it was more significant for non-food products (+2.1%).
tableauTab3_anglais – Monthly turnover indices in large-scale food retailing
| Change in % | ||||
|---|---|---|---|---|
| May/ April | April March | q-o-q (1) | y-o-y (1) | |
| Turnover | 0.8 | 0.2 | 0.0 | –0.1 |
| Including | ||||
| Sales of food products | 1.2 | 0.3 | 0.2 | –0.7 |
| Sales of non-food products | 2.1 | –0.5 | 1.7 | –1.4 |
| Sales of automotive fuel | 1.5 | –0.8 | –3.5 | –5.5 |
- (1) Quarter-on-quarter: last three months / previous three months.
- Source: INSEE - Monthly survey on large-scale food retailing (Emagsa)
Documentation
Methodology (pdf,121 Ko)
Pour en savoir plus
