


 14 October 2014
2014- n° 235In September 2014, prices of frequently purchased goods decreased by 0.2% in hyper
and supermarkets Price Index in large and predominantly-food stores - September 2014
14 October 2014
2014- n° 235In September 2014, prices of frequently purchased goods decreased by 0.2% in hyper
and supermarkets Price Index in large and predominantly-food stores - September 2014
In September 2014, prices of frequently purchased goods were down 0.2% in hyper and supermarkets, after an increase by 0.1% in August 2014.
In September 2014, prices of frequently purchased goods were down 0.2% in hyper and supermarkets, after an increase by 0.1% in August 2014.
In large and predominantly food stores plus neighborhood stores, prices of frequently purchased goods were also down 0.2% in September 204 after +0.1% in August 2014.
Excluding hyper and supermarkets, prices of frequently purchased goods diminished by 0.1% in September 2014 after +0.1% during the previous month.
Year-on-year, prices of frequently purchased goods continued to decline at the same pace
In September 2014, as in August 2014, prices of frequently purchased goods in the hyper and supermarkets dropped by 0.8% year-on-year. In September 2013, they had grown by 0.3% year-on-year.
In large and predominantly food stores plus neighborhood stores, prices of frequently purchased goods declined at the same pace year-on-year (-0.8% in September 2014 as in August 2014; +0.4 in the year to September 2013).
Overall, considering all kinds of stores, the decrease in the prices of frequently purchased goods was slightly less marked year-on-year (-0.6% in September as in August 2014; +0,7 % in September 2013).
graphiqueGraphique1English – Frequently purchased goods price indexesyear-on-year change %
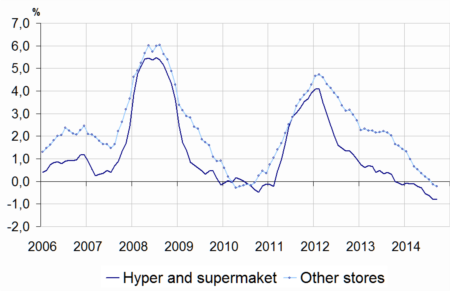
- Source : Insee - Consumer Price Indexes
graphiqueGraphique2English – Frequently purchased goods price indexes
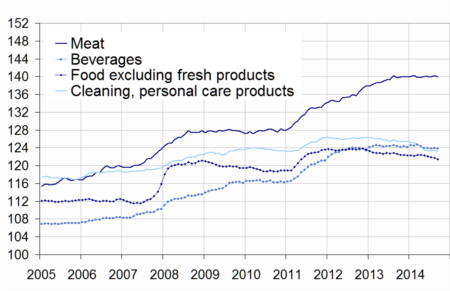
- Source : Insee - Consumer Price Indexes
tableauTableau1English – Prices of frequently purchased goods
| Index September | Changes (%) compared to | ||
|---|---|---|---|
| 2014 | last month (m-o-m) | 12 months before (y-o-y) | |
| Hyper-and-Supermarkets (A) | 126.18 | -0.2 | -0.8 |
| Large and predominantly food stores (A + neighborhood stores) | 127.25 | -0.2 | -0.8 |
| All stores excluding hyper and supermarkets | 135.34 | -0.1 | -0.2 |
| All stores | 129.00 | -0.2 | -0.6 |
- Source : Insee - Consumer Price Indexes
tableauTableau2English – Prices of frequently purchased goods detailed by main items
| Index September | Variations (%) compared to | ||
|---|---|---|---|
| 2014 | last month (m-o-m) | 12 months before (y-o-y) | |
| Food and beverages (excluding unprocessed foodstuffs) | 126.93 | -0.2 | -0.5 |
| - Meat | 139.87 | -0.3 | 0.1 |
| - Beverages | 123.88 | 0.0 | -0.4 |
| - Other food products | 121.45 | -0.2 | -1.0 |
| Cleaning and personal care products | 123.14 | -0.3 | -1.9 |
| Total : Hyper-and-Supermarkets | 126.18 | -0.2 | -0.8 |
- Source : Insee - Consumer Price Indexes
In September 2014, prices of frequently purchased goods decreased in hyper and supermarkets
In hyper and supermarkets, prices of food (excluding fresh foodstuffs) and beverages decreased by 0.2% in September 2014 after being broadly steady in August. Year-on-year, their decline was lower in September 2004 than during the previous month (-0.5% after -0.6%). In September 2013, they were up 0.5% year-on-year.
In September 2014, meat prices went down by 0.3% in hyper and supermarkets after +0.2% in August 2014. Year-on-year, they recovered slightly (+0.1%) after they stabilized in August 2014. In September 2013, they had grown by 3.0%, year-on-year.
Overall, beverage prices in hyper and supermarkets stayed steady in September 2014 (after +0.1% in August 2014). In September 2014, they declined by 0.4% year-on-year after -0,5% during the last two months. In September 2013, they had grown by 0.3%, year-on-year.
Excluding unprocessed products, prices of other food products decreased again in hyper and supermarkets in September 2014 (-0.2% after -0,1%). Year-on-year, they fell by 1,0% in September 2014 (-0.9% in August 2014). They decreased by 0.8% year-on-year in September 2013.
The decrease in prices of cleaning and personal care products continued
In September 2014, prices of cleaning and personal care products were down 0.3% in hyper and supermarkets after they increased by 0.2% in August 2014. Year-on-year, they fell by 1.9%, as during the previous month. In September 2013, they had declined by 0.5% year-on-year.
Pour en savoir plus
