


 20 March 2015
2015- n° 65In February 2015, oil prices bounced back after seven months of decline Prices of oil and raw material imports - February 2015
20 March 2015
2015- n° 65In February 2015, oil prices bounced back after seven months of decline Prices of oil and raw material imports - February 2015
In February 2015, the price of crude oil rose again (+22.5%), following seven months of decline, to average €51.0 per barrel of Brent. Prices of imported commodities except energy in euros climbed (+1.7%), due to an increase in prices of industrial raw materials (+2.4%) and those of minerals (+3.4%).
In February 2015, the price of crude oil rose again (+22.5%), following seven months of decline, to average €51.0 per barrel of Brent. Prices of imported commodities except energy in euros climbed (+1.7%), due to an increase in prices of industrial raw materials (+2.4%) and those of minerals (+3.4%).
Oil prices recovered
In February, the price of crude oil from the North Sea (Brent) in dollars picked up (+19.6% after –22.1%). The signs of a dwindling rig count coupled with a drop in investments from the oil companies seem to be the main triggering factors of a downward reassessment of output prospects and therefore of a rallying barrel price. In euros, the Brent price recovered more sharply (+22.5% after –17.5%), the European currency kept depreciating against the U.S. dollar (–2.4% in February 2015).
Prices of industrial raw materials boosted
In February, prices of industrial raw materials in euros became higher (+2.4% after +1.2% in January), mainly due to the European currency depreciation.
Prices of minerals sped up (+3.4% after -0.1%). Prices of non-ferrous metals bounced back (+5.0% after -1.5%), even though those of precious metals came to a standstill (+0.9% after +9.5%), particularly those of gold (+0.1% after +10.5%), while those of iron ore were slumping again following a one-off increase (-4.7% after +3.7%).
Prices of agricultural raw materials weakened (-0.2% after +4.1%), on account of the drop in paper pulp prices (–0.5% after +5.7%), and those of sawn softwood (-0.8% after +2.2%). However, prices of tropical wood (+3.5% after +2.7%) and those of natural fibers (+5.7% after +4.4%) accelerated. Cotton prices indeed remained dynamic (+6.2% after +4.4%), on account of a downward trend in anticipated arables in China, in India and in the United States. Finally, prices of natural rubber recovered (+0.8% after -0.2%), in line with those of oil.
Prices of raw food materials slowed down
In February, prices of raw food materials in euros decelerated (+0.9% after +2.5%), due to a slowdown in prices of cereals (+2.0% after +5.0%), and those of tropical foodstuffs (+2.9% after +4.3%). Moreover, prices of sugar lessened (-1.3% after +6.4%), the volume of global stocks became high in light of the overall consumption level. Finally, prices of oil seeds and vegetable oils went down again (-4.7% after –1.0%), due to the fall in sunflower oil prices (-2.0% after +1.4%), and those of olive oil (-19.6% after +5.9%).
tableautabpetrole – Oil and petroleum products
| Prices | Change (%) | |||
|---|---|---|---|---|
| of last month | over the last month | over the last 3 months | over the last 12 months | |
| Brent in $ per barrel | 57.9 | 19.6 | –26.1 | –46.7 |
| Brent in € per barrel | 51.0 | 22.5 | –18.8 | –35.8 |
| Gasoline €/L | 0.37 | 28.6 | –11.0 | –28.6 |
| Gas Oil | 497.6 | 21.4 | –12.2 | –26.1 |
| Heavy fuel | 299.9 | 30.1 | –8.4 | –32.2 |
| Naphtha | 433.1 | 28.0 | –14.0 | –35.2 |
- Prices are in euros per tonne unless otherwise specified
- Source: INSEE
tableautabmatprem – Imported raw materials (excluding energy) in euros
| Index | Changes (%) | |||
|---|---|---|---|---|
| over the last month | over the last 3 months | over the last 12 months | ||
| Food total | 215.3 | 0.9 | 3.3 | 12.7 |
| Tropical foodstuffs | 204.5 | 2.9 | 8.5 | 22.1 |
| Oil seeds. vegetable oils | 228.4 | –4.7 | –5.6 | –5.9 |
| Cereals | 159.1 | 2.0 | 9.3 | 7.8 |
| Sugar | 143.1 | –1.3 | 0.4 | 7.4 |
| Beef meat | 183.0 | 6.7 | 9.8 | 39.0 |
| Industrial raw materials | 166.2 | 2.4 | 1.6 | 6.5 |
| Agricultural raw materials | 117.1 | –0.2 | 4.8 | 9.9 |
| Natural Fibers | 117.1 | 5.7 | 12.3 | –9.0 |
| Natural rubber | 163.3 | 0.8 | –5.6 | –19.1 |
| Hides | 104.3 | 1.5 | –0.6 | 16.2 |
| Wood pulp | 108.1 | –0.5 | 6.6 | 19.0 |
| Tropical wood | 112.5 | 3.5 | 6.7 | 11.5 |
| Sawn softwood | 100.2 | –0.8 | 3.7 | 4.2 |
| Minerals | 192.2 | 3.4 | 0.4 | 5.3 |
| Iron ore | 408.7 | –4.7 | –5.8 | –37.8 |
| Non-ferrous metals | 163.9 | 5.0 | 0.4 | 17.5 |
| Precious metals | 242.1 | 0.9 | 13.3 | 7.8 |
| All commodities | 176.9 | 1.7 | 2.3 | 9.1 |
- Source: INSEE
graphiqueG_petrole_ang – Oil

- Source: INSEE
graphiqueG_alim_ang – Food
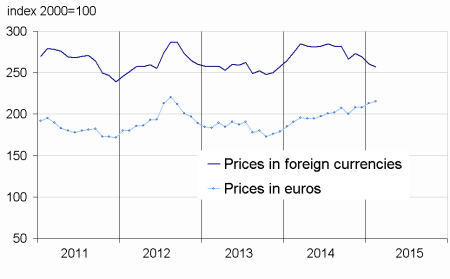
- Source: INSEE
graphiqueG_ensemble_ang – All commodities
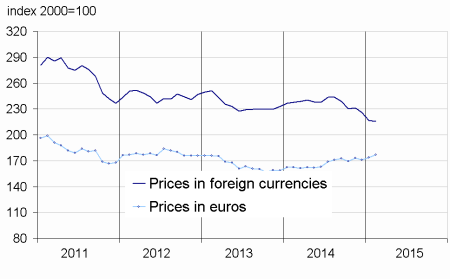
- Source: INSEE
graphiqueG_indus_ang – Industrial raw materials
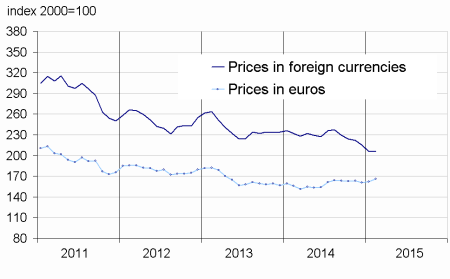
- Source: INSEE
Pour en savoir plus
Time series : Raw materials prices
