


 11 September 2014
2014- n° 208The Consumer Prices Index increased in August 2014 by 0.4% ; it rose by 0.4%, year-on-year Consumer price index - final results - August 2014
11 September 2014
2014- n° 208The Consumer Prices Index increased in August 2014 by 0.4% ; it rose by 0.4%, year-on-year Consumer price index - final results - August 2014
The Consumer Prices Index (CPI) increased by 0.4% in August 2014 after a decline by 0.3% in July 2014. Seasonally adjusted, it was up 0.1%. The CPI grew by 0.4% in the year to August 2014, down from +0.5% in July 2014.
Monthly change: +0.4%; Year-on-year: +0.4%
The Consumer Prices Index (CPI) increased by 0.4% in August 2014 after a decline by 0.3% in July 2014. Seasonally adjusted, it was up 0.1%. The CPI grew by 0.4% in the year to August 2014, down from +0.5% in July 2014.
The steepest consumer price increases in August 2014 came mainly from seasonal rises in some services related to tourism in the middle of the summer and in manufactured product prices at the end of the summer sales in metropolitan France. For these ones, the effect was stronger this year due to a time lag of the price collection that included a fewer number of days during the summer sales in August 2014 (2 days) than last year (7 days in August 2013, for 20 days of data collection for a given month). These price increases were partially offset by a seasonal fall of food prices and a decrease in energy prices.
Manufactured product prices increased at the end of summer sales
Prices of manufactured products increased by 1.9% in August 2014 compared to July 2014 but declined by 0.5% compared to August 2013. After the end of the summer sales, prices of clothing and footwear increased by 10.6% (+1.6% year-on-year) after a fall of 13.4% in July 2014. This seasonal rebound has been intensified this year by a time lag in the price collection calendar. Some price increases due to the end of the summer sales were also observed for household textiles (+3.0%; —0.3% year-on-year), jewellery, clocks and watches (+2.5%; —1.2% year-on-year), glassware, tableware and household utensils (+1.0%; —0.8% year-on-year), furniture and furnishings (+1.5%; —0.2% year-on-year), household appliances (+1.4%; —1.5% year-on-year) and also for beauty products (+1.1%; —0.7% year-on-year).
tableauOLE_LINK2 – Detailed figures for various groups
| Percentage change | ||||
|---|---|---|---|---|
| Items | Weight 2014 | Index Aug. 2014 | Month rate | Annual rate |
| a) All households - France | ||||
| All items (00 E) | 10000 | 128.29 | 0.4 | 0.4 |
| All items SA (00 C) | 10000 | 128.17 | 0.1 | 0.4 |
| Food (4000 E) | 1653 | 130.75 | -0.5 | -1.5 |
| Fresh food (4001 E) | 210 | 129.39 | -4.6 | -8.9 |
| Food excluding fresh products (4002 E) | 1443 | 130.87 | 0.0 | -0.4 |
| Tobacco (4034 E) | 204 | 258.62 | 0.0 | 3.5 |
| MANUFACTURED PRODUCTS (4003 E) | 2653 | 99.58 | 1.9 | -0.5 |
| Clothing and footwear (4004 E) | 438 | 105.53 | 10.6 | 1.6 |
| Medical products (4005 E) | 434 | 78.18 | 0.0 | -2.9 |
| Other manufactured products (4006 E) | 1781 | 103.50 | 0.4 | -0.5 |
| ENERGY (4007 E) | 850 | 177.21 | -0.8 | -1.5 |
| Petroleum products (4008 E) | 475 | 200.40 | -1.1 | -3.3 |
| SERVICES (4009 E) | 4640 | 137.90 | 0.3 | 1.9 |
| Actual rentals and services for dwellings (4010 E) | 748 | 141.67 | 0.1 | 1.4 |
| Medical services (4011 E) | 552 | 121.89 | -0.7 | 0.4 |
| Transport and communication (4012 E) | 503 | 99.39 | 0.6 | 2.1 |
| Other services (4013 E) | 2837 | 149.36 | 0.5 | 2.2 |
| ALL ITEMS EXCLUDING RENTALS AND TOBACCO (5000 E) | 9202 | 125.74 | 0.5 | 0.3 |
| ALL ITEMS EXCLUDING TOBACCO (4018 E) | 9796 | 126.38 | 0.5 | 0.4 |
| b) Manual or clerical worker headed urban households - France | ||||
| ALL ITEMS EXCLUDING TOBACCO (4018 D) | 9707 | 126.16 | 0.4 | 0.3 |
| ALL ITEMS (00 D) | 10000 | 128.95 | 0.4 | 0.4 |
| c) Households that belong to the lowest equivalized disposable income quintile - France | ||||
| ALL ITEMS EXCLUDING TOBACCO (4018 Q) | 9679 | 127.58 | 0.4 | 0.3 |
- Source : Insee - Consumer Price Indexes
tableauTableau1English – Detailed figures for Core inflation* and HICP**
| Percentage change | ||||
|---|---|---|---|---|
| Items | Weight 2014 | Index Aug. 2014 | Month rate | Annual rate |
| All items "Core inflation" (4022 S) | 6053 | 122.86 | 0.3 | 0.4 |
| Food excluding fresh products, meat, milk and exotic products (4019 S) | 713 | 124.60 | -0.1 | -1.1 |
| Manufactured products (4020 S) | 2162 | 104.59 | 0.6 | -0.6 |
| Services including actual rentals and services for dwellings (4021 S) | 3178 | 140.19 | 0.3 | 1.3 |
| All items HICP (00 H) | 115.97 | 0.5 | 0.5 | |
- * ISJ : Core inflation indicator excludes public sector prices, the most volatile consumer prices and the tax measures. Seasonally adjusted, this index is calculated for all households in France excluding overseas departments and territories (base 100 1998).
- **HICP : Harmonised Indices of Consumer Prices are inflation figures designed for international comparison of consumer price inflation between Member states of the Union. This index is calculated for all households in France (base 100 2005).
- Source : Insee - Consumer Price Indexes
graphiqueGraphique1English – Consumer price index (IPC) and Core inflation (ISJ) – year-on-year changes
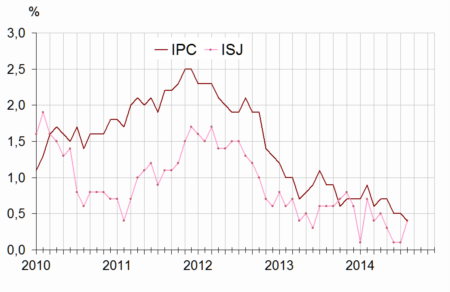
- Source : Insee - Consumer Price Indexes
Seasonal rebound in the price of services
In August 2014, service prices rose by 0.3% (+1.9% year-on-year), mainly as a result of the seasonal increase in the prices of holiday accomodation services (+12.9%; +3.6% year-on-year) and in the prices of package holidays (+8.2%; +1.6% year-on-year). Moreover, airfares went up in August 2014 (+1.9%; +1.1% year-on-year). Conversely, as every year in August, the tariffs of hotels and boarding houses (—1.6%; +1.8% year-on-year) as well as those of toll facilities and parking meters (—0.6%; +2.1% year-on-year) decreased, consequence of free car parking in several big cities.
Seasonal decrease in food prices
In August 2014, food prices decreased by 0.5%, as in July 2014 (1.5% year-on-year) as a result of the seasonal drop in the prices of unprocessed products (—4.6%; —8.9% year-on-year), especially those of fresh fruits (—7.0%; —13.0% year-on-year) and those of fresh vegetables (—4.5%; —9.4% year-on-year) while those of fresh fishes and seafood increased sharply (+1.6%; +3.3% year-on-year). Excluding unprocessed products, food prices remained broadly stable in August 2014 (—0.4% year-on-year). This relative stability hid contrasted developments considering the different consumption sectors. Thus, the prices of meat were still rising but have slowed down.
Decline in energy prices
Energy prices decreased by 0.8% in August 2014 compared to July 2014 and by 1.5% compared to August 2013. The largest downward pressures came from a further reduction in city gas prices (—1.2% in August 2014 after —0.4% in July 2014; —3.1% year-on-year) and from a drop of the petroleum product prices (—1.1%; —3.3% year-on-year). The fall in prices was stronger for motor fuels (—1.3%; —3.3% year-on-year) than for heating fuel (—0.8%; —4.4% year-on-year). Furthermore, the prices of electricity remained steady in August 2014 (+2.7% year-on-year) while they had grown by 4.0% in August 2013.
Core inflation increased in August 2014
In August 2014, the core inflation indicator (ISJ) increased by 0.3% compared to July 2014 and by 0.4% compared to August 2014, up from July 2014 (+0.1% year-on-year). This acceleration came, mainly, from the lower number of days of prices collection during the summer sales in August this year compared to the same month last year. The Harmonized Index of Consumer Prices (HICP) increased by 0.5% in August 2014; its annual rate of change stood at +0.5% in August 2014, down from +0.6% in June and July 2014.
Pour en savoir plus
