


 17 November 2014
2014- n° 262In October 2014, oil prices kept decreasing sharply Prices of oil and raw material imports - October 2014
17 November 2014
2014- n° 262In October 2014, oil prices kept decreasing sharply Prices of oil and raw material imports - October 2014
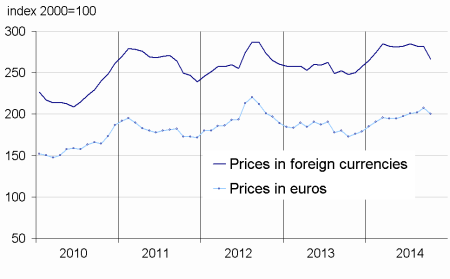
In October 2014, the price of crude oil in euro terms declined sharply (-8.7%) and averaged €68.9 per barrel of Brent. Prices of imported commodities except energy in euros went down (-2.1%), either those of raw food materials (-3.7%), industrial raw materials (-0.9%) or minerals (-1.4%).
In October 2014, the price of crude oil in euro terms declined sharply (-8.7%) and averaged €68.9 per barrel of Brent. Prices of imported commodities except energy in euros went down (-2.1%), either those of raw food materials (-3.7%), industrial raw materials (-0.9%) or minerals (-1.4%).
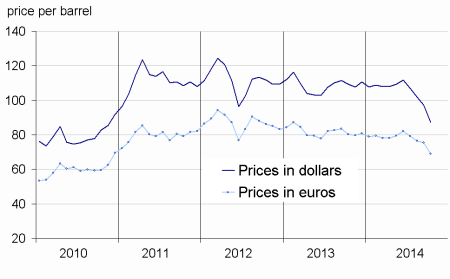
Oil prices plummeted and reached their lowest since December 2010
In October, the price of crude oil from the North Sea (Brent) in dollars slumped (-10.3% after -4.5%), as a result of a slowdown in the Chinese and emerging countries’ demand on the one hand and a sharp improvement in the American non conventional oil output on the other. In euros, the Brent price dropped less sharply (-8.7% after -1.5%), the European currency having depreciated against the U.S. Dollar (-1.8%).
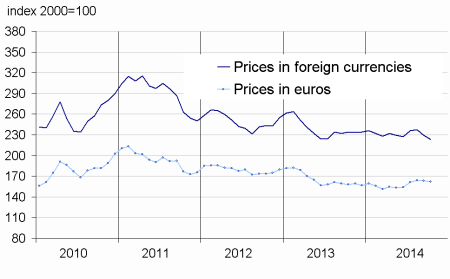
Prices of industrial raw materials fell again
In October, prices of industrial raw materials in euros kept going down (-0.9% after -0.2% in September). Prices of agricultural raw materials decelerated (+0.5% after +2.2%), due to a weakening in prices of hides (+1.8% after +5.3%), in those of wood pulp (+1.8% after +3.4%) and the drop in prices of natural fibers (-1.9% after +2.1%). Natural rubber prices continued to fall (-2.9% after -3.2%), marked by an overproduction period, a weak Chinese demand and the competing presence of synthetic, oil-derived rubber. The decline in minerals became more marked (-1.4% after –1.0%). Prices of iron ore slid again (-0.9% after -8.3%), on the back of an output glut. Prices of non-ferrous metals went down as well (-1.5% after +0.7%). In particular, prices of nickel plunged (-11.2% after +0.3%), on account of a continuing rise in stocks. The decline in precious metals was less marked (-1.3% after -4.2%), thanks to the rallying of palladium prices (+4.4% after -12.0%).
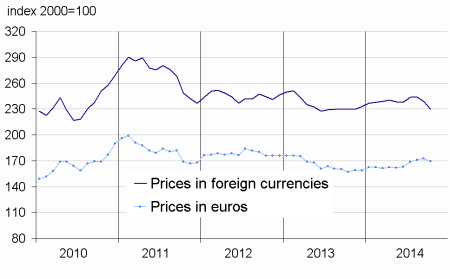
Prices of raw food materials came down
In October, prices of raw food materials dropped (-3.7% after +2.8%), due to the fall in prices of oil seeds and vegetable oils (-16.2% after +6.3%). In particular, the prices of soybean meals decreased considerably (-26.8% after +11.2%), following the American announcement of higher than expected soya crop. Prices of sugar recovered (+14.9% after -5.3%), on account of a sugar cane crop that was lower than foreseen in drought-affected Brazilian areas.
tableautabpetrole – Oil and petroleum products
| Prices | Change (%) | |||
|---|---|---|---|---|
| of last month | over the last month | over the last 3 months | over the last 12 months | |
| Brent in $ per barrel | 87.3 | –10.3 | –18.4 | –20.2 |
| Brent in € per barrel | 68.9 | –8.7 | –13.1 | –14.1 |
| Gasoline €/L | 0.47 | –12.4 | –14.8 | –3.7 |
| Gas Oil | 594.8 | –7.8 | –9.7 | –12.6 |
| Heavy fuel | 378.7 | –13.6 | –14.1 | –14.0 |
| Naphtha | 575.9 | –12.5 | –17.2 | –13.1 |
- Prices are in euros per tonne unless otherwise specified
- Source : Insee
tableautabmatprem – Imported raw materials (excluding energy) in euros
| Index | Changes (%) | |||
|---|---|---|---|---|
| over the last month | over the last 3 months | over the last 12 months | ||
| Food total | 200.1 | –3.7 | –0.3 | 15.7 |
| Tropical foodstuff | 197.6 | 1.9 | 9.0 | 37.0 |
| Oil seeds. vegetable oils | 215.5 | –16.2 | –6.6 | –2.2 |
| Cereals | 143.5 | 2.5 | 4.1 | –3.8 |
| Sugar | 145.6 | 14.9 | 2.1 | –5.7 |
| Beef meat | 159.3 | 7.3 | –2.5 | 38.7 |
| Industrial raw materials | 162.2 | –0.9 | 0.7 | 2.6 |
| Agricultural raw materials | 111.3 | 0.5 | 4.9 | 5.9 |
| Natural fibers | 106.4 | –1.9 | –9.1 | –14.1 |
| Natural rubber | 170.6 | –2.9 | –6.3 | –31.8 |
| Hides | 103.5 | 1.8 | 12.2 | 30.5 |
| Wood pulp | 99.7 | 1.8 | 7.1 | 13.9 |
| Tropical wood | 105.7 | 0.3 | 0.2 | 7.5 |
| Sawn softwood | 98.8 | –0.8 | 5.4 | 3.3 |
| Minerals | 189.4 | –1.4 | –0.7 | 1.4 |
| Iron ore | 467.9 | –0.9 | –11.2 | –35.0 |
| Non-ferrous metals | 158.6 | –1.5 | 1.9 | 12.9 |
| Precious metals | 218.6 | –1.3 | –6.1 | –4.1 |
| All commodities | 169.1 | –2.1 | 0.3 | 7.7 |
- Source : Insee
graphiqueG_petrole_ang – Oil
- Source : Insee
graphiqueG_alim_ang – Food
- Source : Insee
graphiqueG_ensemble_ang – All commodities
- Source : Insee
graphiqueG_indus_ang – Industrial raw materials
- Source : Insee
Pour en savoir plus
Time series : Raw materials prices
