


 10 September 2015
2015- n° 217Employment increased slightly in Q2 2015 Payroll employment - 2nd Quarter 2015
10 September 2015
2015- n° 217Employment increased slightly in Q2 2015 Payroll employment - 2nd Quarter 2015
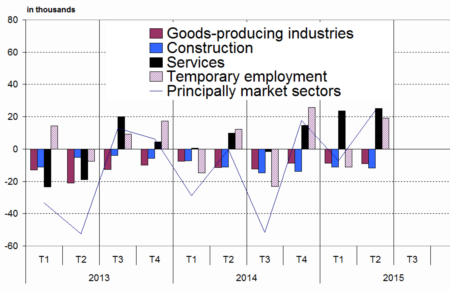
In Q2 2015, payroll employment in non-farm market sectors slighty increased (+23,800 jobs, +0.2%) after a relative stability in the previous quarter (–7,100 jobs that is 0.0%). Excluding temporary work, employment remained stable (+4,600 jobs, i.e. 0.0%, after +4,000 jobs in Q1 2015). Year-on-year, principally market sectors lost 17,400 jobs (–0.1%).
In Q2 2015, payroll employment in non-farm market sectors slighty increased (+23,800 jobs, +0.2%) after a relative stability in the previous quarter (–7,100 jobs that is 0.0%). Excluding temporary work, employment remained stable (+4,600 jobs, i.e. 0.0%, after +4,000 jobs in Q1 2015). Year-on-year, principally market sectors lost 17,400 jobs (–0.1%).
Employment have continued to fall in industry and construction
Industry and construction continued to shrink in Q2 2015 at the same pace as in Q1 2015 (–9,000 jobs for the industry, that is –0.3% and –11,600 jobs for the construction, that is –0.9 %).
Year-on-year, industry lost 39,000 jobs (–1.2%) whereas construction shed 51,200 jobs (–3.7%).
Employment accelerated in services, notably because of the temporary employment
Temporary employment bounced back in Q2 2015 : +19,100 jobs (+3.6%) after –11,000 jobs in Q1 2015.
At the same time, employment in services excluding temporary work incresased at the same pace as in the previous quarter (+25,200 jobs, after +23,700 in Q1 2015).
Overall, employment in market services sector continued to increase (+44,300 jobs, that is +0.4%, after +12,700 in the precedent quarter).
Finally, year-on-year, temporary employment rose (+10,900 jobs, i.e. +2.0%) and market services sector as a whole created 72,800 jobs (+0.6%).
tableautableau_1 – Payroll employment change in the competitive sector : thousands …
| Change in 3 months | Change in 1 year | Level | ||
|---|---|---|---|---|
| 2015 | 2015 | 2015 | 2015 | |
| Q1 | Q2 | Q2 | Q2 | |
| Principally market sectors | –7,1 | 23,8 | –17,4 | 15841,1 |
| Goods-producing industries excl. Construction | –8,7 | –9,0 | –39,0 | 3122,3 |
| Manufacturing | –8,3 | –9,0 | –40,6 | 2753,9 |
| Construction | –11,0 | –11,6 | –51,2 | 1326,5 |
| Services | 12,7 | 44,3 | 72,8 | 11392,3 |
| of which : Temporary employment | –11,0 | 19,1 | 10,9 | 549,1 |
| Principally non-market sectors (*) | 6,6 | 8,2 | 27,5 | 2006,2 |
| Total competitive sector (*) | –0,5 | 32,0 | 10,0 | 17847,3 |
tableautableau_2 – ... Percentage
| Change in 3 months | Change in 1 year | ||
|---|---|---|---|
| 2015 | 2015 | 2015 | |
| Q1 | Q2 | Q2 | |
| Principally market sectors | 0.0 | 0.2 | –0.1 |
| Goods-producing industries excl. Construction | –0.3 | –0.3 | –1.2 |
| Manufacturing | –0.3 | –0.3 | –1.5 |
| Construction | –0.8 | –0.9 | –3.7 |
| Services | 0.1 | 0.4 | 0.6 |
| of which : Temporary employment | –2.0 | 3.6 | 2.0 |
| Principally non-market sectors (*) | 0.3 | 0.4 | 1.4 |
| Total competitive sector (*) | 0.0 | 0.2 | 0.1 |
- (*) Excl. Agriculture and public employees in non-markets sectors (administration, health, education and social activity), metropolitan France ; na : not available
- Source: INSEE
tableautableau_4 – Payroll employment change in the competitive sector (*)
| Code | Change in 3 months | Change in 1 year | Level | ||
|---|---|---|---|---|---|
| Naf | 2015 | 2015 | 2015 | 2015 | |
| rev.2 | Q1 | Q2 | Q2 | Q2 | |
| DE | Energy, Water and Waste | –0,4 | 0,0 | 1,5 | 368,4 |
| C1 | Food products | 0,6 | –0,4 | 0,4 | 544,7 |
| C2 | Coke and refined petroleum | 0,0 | 0,0 | –0,2 | 9,7 |
| C3 | Machinery and equipment goods | –2,1 | –1,3 | –8,9 | 427,6 |
| C4 | Transport equipment | –1,3 | –1,3 | –6,6 | 345,4 |
| C5 | Other industrial goods | –5,4 | –5,9 | –25,2 | 1426,5 |
| FZ | Construction | –11,0 | –11,6 | –51,2 | 1326,5 |
| GZ | Trade | 4,7 | 7,5 | 6,5 | 3008,2 |
| HZ | Transportation | 0,6 | 2,0 | 0,4 | 1337,7 |
| IZ | Accommodation and food services | 5,2 | 7,8 | 16,9 | 994,3 |
| JZ | Information and communication | –0,5 | 1,0 | 5,3 | 711,3 |
| KZ | Financial services | 2,7 | 3,8 | 10,0 | 850,8 |
| LZ | Real estate services | 0,5 | –0,1 | –0,9 | 229,8 |
| MN | Business services | –2,8 | 25,6 | 32,8 | 2985,8 |
| of which : Temporary employment | –11,0 | 19,1 | 10,9 | 549,1 | |
| OQ | Non-marketservices | 6,6 | 8,2 | 27,5 | 2006,2 |
| RU | Households' services | 2,3 | –3,4 | 1,6 | 1274,4 |
- (*) Excl. Agriculture and public employees in non-markets sectors (administration, health, education and social activity), metropolitan France.
- Source : INSEE
graphiqueGraph2 – Evolution of principally market sectors
Payroll employment estimation of the first quarter of 2015 on principally market sectors is revised downwards by 6,400 jobs. The estimation of the second quarter of 2015 is revised downwards by 3,500 jobs compared to the Flash estimation released on 14 August 2015.
Documentation
Methodology (pdf,135 Ko)
Pour en savoir plus
