


 18 November 2015
2015- n° 278Business start-ups were stable in October 2015 Enterprise births - October 2015
18 November 2015
2015- n° 278Business start-ups were stable in October 2015 Enterprise births - October 2015
In October 2015, the number of business births was stable after a sharp rebound in September (for all entreprises, seasonally and working-day adjusted). Excluding self managed micro-entrepreneurs, business start-ups decreased slightly (–0.5%). This drop was offset by the growth of self-managed micro-entrepreneurs' registrations (+0.7%).
In October 2015, the number of business births was stable after a sharp rebound in September (for all entreprises, seasonally and working-day adjusted). Excluding self managed micro-entrepreneurs, business start-ups decreased slightly (–0.5%). This drop was offset by the growth of self-managed micro-entrepreneurs' registrations (+0.7%).
–4.1% year-on-year (quarterly basis)
The raw amount of births added up in the last three months came down by 4.1% compared to the same months one year before, for all entreprises, mainly because of the self-managed micro-entrepreneurs (–21.7%). Trade and construction were the sectors that most contributed to this decline1. On the opposite, clearly more start-ups were created in the sectors of transportation and real estate activities compared to the same period last year.
–3.7% year-on-year (twelve months basis)
The raw number of business start-ups totted up during the last twelve months decreased by 3.7% year-on-year, due to the decline in self-managed micro-entrepreneurs' set-ups (–17.2%). However, for other types of enterprises start-ups increased (+22.1% for sole proprietorships excluding self-managed micro-enterprises and +3.4% for companies).
A little less than one out of two business set-ups is a self-managed micro-entrepreneur's registration
In October 2015, 44.2% of business set-ups over the last twelve months were micro–entrepreneurs' registrations.
tableautab0EN – Business set-ups distribution by type
| Aug. 2015 | Sept. 2015 | Oct. 2015 | |
|---|---|---|---|
| Companies | 31.7 | 32.0 | 32.2 |
| Sole proprietorships excluding self-managed micro-entrepreneurs | 22.2 | 22.9 | 23.6 |
| Self-managed micro-entrepreneurs | 46.1 | 45.2 | 44.2 |
- Source: INSEE (Sirene)

1 The contribution of a sector to the overall variation is the observed variation of this sector, weighted by the share of this sector in the total number of births.
graphiqueGraph1EN – Business start-ups (sa-wda *)
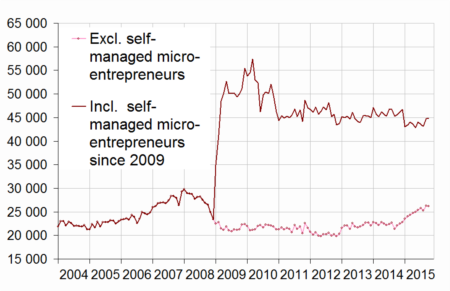
- * Seasonally and working-day adjusted data
- Source: INSEE (Sirene)
graphiqueGraph2EN – Trade and business support activities start-ups (sa-wda *)
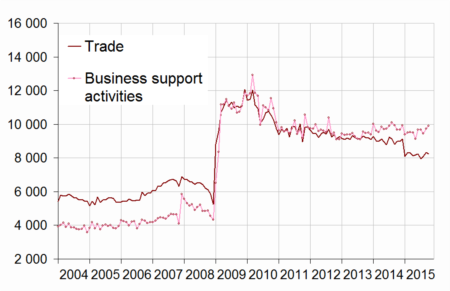
- * Seasonally and working-day adjusted data
- Source: INSEE (Sirene)
graphiqueGraph3EN – Construction and real estate business start-ups (sa-wda *)
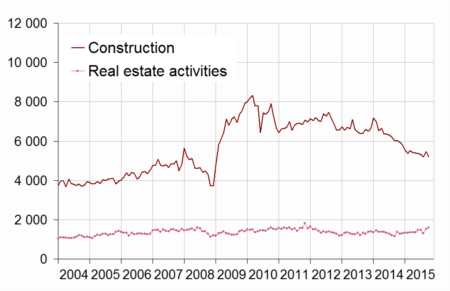
- * Seasonally and working-day adjusted data
- Source: INSEE (Sirene)
tableautab1EN – Business set-ups by month (sa-wda *)
| July 2015 | Aug. 2015 | Sept. 2015 | Oct. 2015 | |
|---|---|---|---|---|
| Excl. self-managed micro-entrepreneurs | 25,756 | 25,278 | 26,319 | 26,199 |
| Variation [m-o-m] % | 1.4 | -1.9 | 4.1 | -0.5 |
| Incl. self-managed micro-entrepreneurs | 43,585 | 43,145 | 44,772 | 44,785 |
| Variation [m-o-m] % | -1.1 | -1.0 | 3.8 | 0.0 |
- * Seasonally and working-day adjusted data
- Source: INSEE (Sirene)
tableautab2EN – Business start-ups by type
| Moving total % change * | Moving total | Moving total | ||
|---|---|---|---|---|
| over 3 months | over 12 months | January- October 2015 | January- October 2014 | |
| Total | -4.1 | -3.7 | 440,765 | 464,608 |
| Companies | 5.2 | 3.4 | 141,789 | 137,808 |
| Sole proprietorships | -7.7 | -6.7 | 298,976 | 326,800 |
| Of which self-managed micro-entrepreneurs | -21.7 | -17.2 | 189,839 | 240,498 |
- * Total of business start-ups during the last 3 or 12 months compared with the same months a year earlier
- Source: INSEE (Sirene)
tableautab3EN – Number of business set-ups (incl. self-managed micro-enterprises)
| NA | Aug. 2015 | Sept. 2015 | Oct. 2015 | |
|---|---|---|---|---|
| Total | 43,145 | 44,772 | 44,785 | |
| Industry | BE | 2,055 | 2,039 | 2,049 |
| Of which Manufacturing | C | 1,769 | 1,795 | 1,797 |
| Construction | FZ | 5,206 | 5,460 | 5,204 |
| Wholesale and retail trade, Transport, Accommodation and Food and beverage activities | GI | 12,207 | 12,814 | 13,024 |
| Of which Trade | G | 8,087 | 8,320 | 8,240 |
| Of which Transportation and storage | H | 1,384 | 2,106 | 2,524 |
| Of which Accommodation and food service activities | I | 2,379 | 2,420 | 2,443 |
| Information and communication | JZ | 2,077 | 2,094 | 2,064 |
| Financial and insurance activities | KZ | 1,153 | 1,331 | 1,316 |
| Real estate activities | LZ | 1,310 | 1,521 | 1,609 |
| Business support activities | MN | 9,459 | 9,729 | 9,919 |
| Public administration and defence, education, human health and social work activities | OQ | 5,608 | 5,483 | 5,544 |
| Other services activities | RS | 4,070 | 4,301 | 4,056 |
- * Seasonally and working-day adjusted data
- Source: INSEE (Sirene)
tableautab3bisEN – Fluctuation in the number of business set-ups (incl. self-managed micro-entrepreneurs)
| NA | Oct. 15 / Sept. 15 | Moving total % change** | ||
|---|---|---|---|---|
| sa-wda * | over 3 months | over 12 months | ||
| Total | 0.0 | -4.1 | -3.7 | |
| Industry | BE | 0.5 | -15.5 | -13.5 |
| Of which Manufacturing | C | 0.1 | -17.9 | -14.9 |
| Construction | FZ | -4.7 | -14.0 | -15.7 |
| Wholesale and retail trade, Transport, Accommodation and Food and beverage activities | GI | 1.6 | -1.3 | -1.4 |
| Of which Trade | G | -1.0 | -10.0 | -8.1 |
| Of which Transportation and storage | H | 19.8 | 69.9 | 54.8 |
| Of which Accommodation and food service activities | I | 0.9 | -6.3 | -2.0 |
| Information and communication | JZ | -1.4 | -8.7 | -2.3 |
| Financial and insurance activities | KZ | -1.1 | 3.7 | 10.6 |
| Real estate activities | LZ | 5.8 | 17.7 | 3.5 |
| Business support activities | MN | 1.9 | -1.8 | -1.7 |
| Public administration and defence, education, human health and social work activities | OQ | 1.1 | -0.1 | 4.1 |
| Other services activities | RS | -5.7 | -8.5 | -7.4 |
- * Seasonally and working-day adjusted data
- ** Total of business start-ups during the last 3 or 12 months compared with the same months a year earlier
- Source: INSEE (Sirene)
Pour en savoir plus
Time series : Business demography
