


 22 May 2015
2015- n° 124In May 2015, the economic climate remains unfavorable in the building construction
industry Monthly survey of building - May 2015
22 May 2015
2015- n° 124In May 2015, the economic climate remains unfavorable in the building construction
industry Monthly survey of building - May 2015
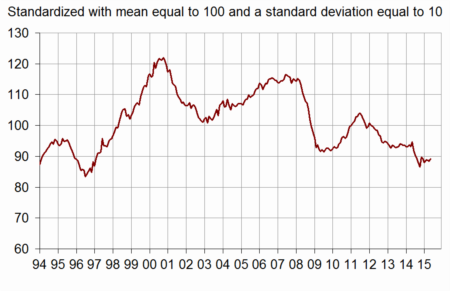
According to the business managers surveyed in May 2015, the business climate remains deteriorated in the building construction industry. The composite indicator is almost stable (+1 point at 89), and stays well below its long-term average (100). The turning point indicator remains in the neutral zone.
According to the business managers surveyed in May 2015, the business climate remains deteriorated in the building construction industry. The composite indicator is almost stable (+1 point at 89), and stays well below its long-term average (100). The turning point indicator remains in the neutral zone.
Business managers' opinion remains deteriorated about their activity
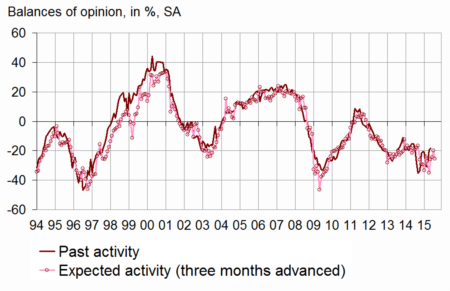
In May 2015, slightly more business managers than in April forecast a fall in their activity for the next few months. Almost as many business managers as in April declare a fall in their activity in the recent period. The balances of opinion of past and expected activity remain far below their long-term average.
graphiqueActivity – Activity tendency in the building industry
A little less pessimism about employment
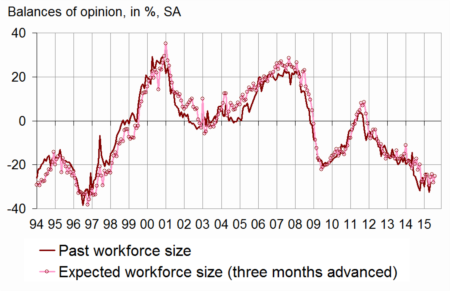
In May, slightly fewer business managers than in April indicate a fall in their staff size in the recent period and for the next few months. However the corresponding balances remain substantially below their long-term average.
graphiqueWorkforce – Workforce size tendency in the building industry
graphiqueClimate – Composite indicator
graphiqueTurningPoint – Turning-point indicator
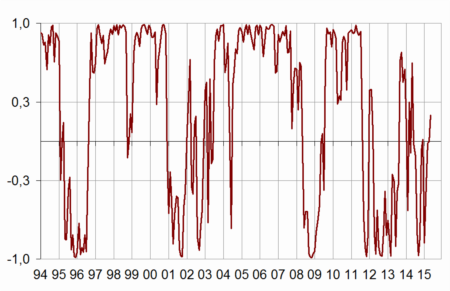
- Lecture: close to 1 (respectively -1), it indicates a favorable climate (respectively unfavorable).
tableauTableau1 – Building industry economic outlook
| Mean* | Feb. 15 | March 15 | April 15 | May 15 | |
|---|---|---|---|---|---|
| Composite indicator | 100 | 89 | 89 | 88 | 89 |
| Past activity | –4 | –30 | –31 | –19 | –18 |
| Expected activity | –6 | –26 | –25 | –20 | –25 |
| Gen. business outlook | –19 | –35 | |||
| Past employment | –4 | –24 | –25 | –33 | –28 |
| Expected employment | –4 | –26 | –24 | –28 | –25 |
| Opinion on order books | –22 | –58 | –57 | –56 | –55 |
| Order books (in month) | 5,4 | 6,2 | 6,5 | 6,6 | 6,5 |
| Production capacity utilisation rate | 88,7 | 83,6 | 83,8 | 83,9 | 83,7 |
| Obstacles to production increase (in %) | 33 | 19 | 21 | 20 | 16 |
| - Because of workforce shortage (in %) | 14,8 | 3,0 | 2,4 | 2,8 | 2,8 |
| Recruiting problems (in %) | 58 | 37 | |||
| Expected prices | –14 | –36 | –34 | –35 | –36 |
| Cash-flow position | –10 | –23 | |||
| Repayment period | 29 | 43 |
- * Mean since September 1993.
- Source: French business survey in the building industry - INSEE
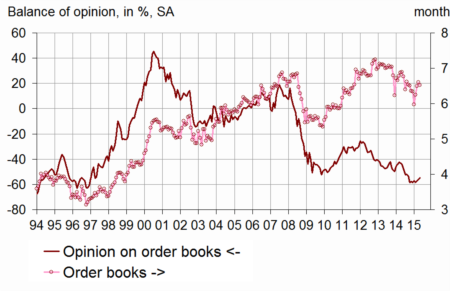
Order books are still considered lower than normal
Business managers’ opinion about their order books remains deteriorated. The corresponding balance is virtually stable, stuck at a very low level since October 2014. The number of months covered by these order books is almost stable (6.5 months), above its long term average (5.4 months).
graphiqueOrderBooks – Order books
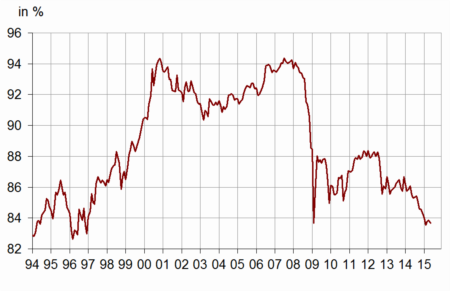
Production capacity utilisation rate at its lowest level since 2009
In May 2015, the production capacity utilisation rate is virtually stable, after a sharp decline since early 2014. It has reached its lowest level since 2009. At the same time, a little less than one business manager out of six has reported difficulties to increase its output, against one out of three in average since 1993.
graphiquePcur – Production capacity utilization rate
Prices are very tight
In May, as many business managers as in April indicate price falls. The corresponding balance remains substantially below its long-term average.
Documentation
Methodology (2016) (pdf,170 Ko)
Pour en savoir plus
