


 26 March 2015
2015- n° 72Household’s purchasing power declined in Q4 2014 (–0.2%) but increased over the year
(+1.1%) Quarterly national accounts - detailed figures - 4th Quarter 2014
26 March 2015
2015- n° 72Household’s purchasing power declined in Q4 2014 (–0.2%) but increased over the year
(+1.1%) Quarterly national accounts - detailed figures - 4th Quarter 2014
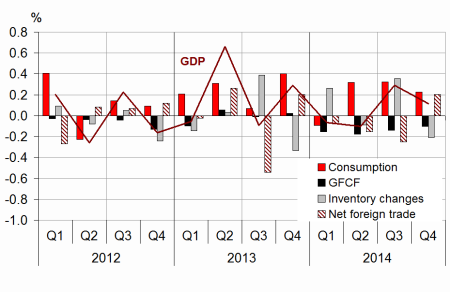
In Q4 2014, GDP in volume terms increased by 0.1%. Over the year, GDP rose by 0.4% as in 2013. The previous estimation (February 13th, 2014) is thus broadly confirmed.
In Q4 2014, GDP in volume terms increased by 0.1%. Over the year, GDP rose by 0.4% as in 2013. The previous estimation (February 13th, 2014) is thus broadly confirmed.
Household consumption expenditure increased slightly in Q4 2014 (+0.2% after +0.3% in Q3 2014). Conversely, total gross fixed capital formation (GFCF) decreased again (–0.5% after –0.6%). Thus, final domestic demand (excluding inventory changes) rose slightly and contributed for +0.1 points to GDP after +0.2 points in Q3. Exports accelerated markedly in Q4 (+2.5% after +1.0%), while imports kept on increasing (+1.7% as in the previous quarter). Finally, foreign trade balance contributed positively to activity: +0.2 points after –0.2 points. However, changes in inventories contributed for –0.2 points, after +0.4 points in the previous quarter.
Households’ purchasing power decreased in Q4 2014 (–0.2%) but increased over the year (+1.1%)
In nominal terms, households’ gross disposable income (GDI) stepped back in Q4 (–0.1%, after +0.5% in the previous quarter). Wages received by households rose at the same rate as during the previous quarter (+0.3%) but taxes on incomes and wealth accelerated (+3.8% after –0.1%) due to the impact of several new measures for 2014 (abolition of income tax exemptions and reduction of the cap on the family quotient). In Q3 their effect on the income tax revenues was offset by lower taxes on the income of modest households.

* This growth rate is seasonally and working-day adjusted; volumes are chain-linked previous-year-prices volumes.
graphiqueGraph1 – GDP and its main components
tableauTab1 – Goods and services:supply and uses chain-linked volumes
| 2014 Q1 | 2014 Q2 | 2014 Q3 | 2014 Q4 | 2013 | 2014 | |
|---|---|---|---|---|---|---|
| GDP | -0.1 | -0.1 | 0.3 | 0.1 | 0.4 | 0.4 |
| Imports | 0.8 | 0.7 | 1.7 | 1.7 | 1.9 | 3.9 |
| Household consumption *expenditure | -0.3 | 0.4 | 0.3 | 0.2 | 0.3 | 0.6 |
| General government's *consumption expenditure | 0.3 | 0.5 | 0.6 | 0.5 | 2.0 | 1.9 |
| GFCF | -0.7 | -0.8 | -0.6 | -0.5 | -0.8 | -1.6 |
| *of which Non-financial corporated and unincorporated enterprises | -0.3 | -0.2 | 0.0 | -0.2 | -0.6 | 0.7 |
| Households | -1.7 | -1.6 | -1.6 | -1.5 | -3.1 | -5.9 |
| General government | -0.8 | -1.7 | -1.7 | -0.1 | 1.1 | -3.3 |
| Exports | 0.6 | 0.2 | 1.0 | 2.5 | 2.4 | 2.9 |
| Contributions : | ||||||
| Internal demand excluding inventory changes | -0.2 | 0.1 | 0.2 | 0.1 | 0.4 | 0.4 |
| Inventory changes | 0.3 | -0.1 | 0.4 | -0.2 | -0.2 | 0.3 |
| Net foreign trade | -0.1 | -0.2 | -0.2 | 0.2 | 0.1 | -0.3 |
tableauTab2 – Sectoral accounts
| 2014 Q1 | 2014 Q2 | 2014 Q3 | 2014 Q4 | 2013 | 2014 | |
|---|---|---|---|---|---|---|
| Profit ratio of NFC* (level) | 29.9 | 29.3 | 29.5 | 29.9 | 29.8 | 29.7 |
| Household purchasing power | 0.7 | 0.5 | 0.6 | -0.2 | 0.0 | 1.1 |
- *NFC: non-financial corporations
tableauTab3 – Production, Consumption and GFCF: main components
| 2014 Q1 | 2014 Q2 | 2014 Q3 | 2014 Q4 | 2013 | 2014 | |
|---|---|---|---|---|---|---|
| Production of branches | 0.0 | -0.1 | 0.5 | 0.1 | 0.5 | 0.6 |
| Goods | 0.1 | -0.3 | 0.8 | -0.5 | -0.2 | -0.1 |
| Manufactured Industry | 0.5 | -0.7 | 0.6 | -0.1 | -0.6 | 0.3 |
| Construction | -1.3 | -1.3 | -1.0 | -0.8 | -1.2 | -2.9 |
| Market services | 0.1 | 0.1 | 0.6 | 0.4 | 0.9 | 1.2 |
| Non-market services | 0.4 | 0.3 | 0.5 | 0.3 | 1.5 | 1.5 |
| Household consumption | -0.3 | 0.4 | 0.3 | 0.2 | 0.3 | 0.6 |
| Food products | -0.9 | 0.8 | -0.3 | 0.7 | 0.1 | 0.4 |
| Energy | -4.7 | 1.7 | 1.2 | -2.2 | 0.8 | -5.7 |
| Engineered goods | 0.4 | -0.5 | 0.3 | 0.6 | -1.0 | 1.7 |
| Services | 0.1 | 0.2 | 0.2 | 0.2 | 0.6 | 0.6 |
| GFCF | -0.7 | -0.8 | -0.6 | -0.5 | -0.8 | -1.6 |
| Manufactured goods | -0.1 | -0.8 | -0.2 | -0.4 | -0.9 | 0.3 |
| Construction | -1.3 | -1.5 | -1.4 | -1.0 | -1.6 | -3.9 |
| Market services | -0.1 | 0.2 | 0.1 | 0.2 | 0.3 | 0.4 |
tableauTab4 – Households’ disposable income and ratios of households’ account
| 2014 Q1 | 2014 Q2 | 2014 Q3 | 2014 Q4 | 2013 | 2014 | |
|---|---|---|---|---|---|---|
| HDI | 1.1 | 0.5 | 0.5 | -0.1 | 0.6 | 1.6 |
| Household purchasing power | 0.7 | 0.5 | 0.6 | -0.2 | 0.0 | 1.1 |
| HDI by cu* (purchasing power) | 0.5 | 0.3 | 0.5 | -0.3 | -0.6 | 0.4 |
| Adjusted HDI (purchasing power) | 0.6 | 0.5 | 0.6 | 0.0 | 0.5 | 1.3 |
| Saving rate (level) | 15.4 | 15.4 | 15.7 | 15.4 | 15.1 | 15.5 |
| Financial saving rate (level) | 6.3 | 6.6 | 6.9 | 6.7 | 5.8 | 6.6 |
- *cu: consumption unit
tableauTab5 – Ratios of non-financial corporations’ account
| 2014 Q1 | 2014 Q2 | 2014 Q3 | 2014 Q4 | 2013 | 2014 | |
|---|---|---|---|---|---|---|
| Profit share | 29.9 | 29.3 | 29.5 | 29.9 | 29.8 | 29.7 |
| Investment ratio | 22.7 | 22.8 | 22.7 | 22.4 | 22.6 | 22.7 |
| Savings ratio | 16.9 | 16.9 | 17.0 | 17.9 | 17.1 | 17.2 |
| Self-financing ratio | 74.5 | 74.3 | 75.1 | 79.9 | 75.8 | 76.0 |
tableauTab6 – Expenditure, receipts and net borrowing of public administrations
| 2014 Q1 | 2014 Q2 | 2014 Q3 | 2014 Q4 | 2013 | 2014 | |
|---|---|---|---|---|---|---|
| In billions of euros | ||||||
| Total expenditure | 305.4 | 305.7 | 307.3 | 308.3 | 1207.3 | 1226.6 |
| Total receipts | 285.1 | 284.0 | 285.3 | 287.2 | 1120.7 | 1141.7 |
| Net lending (+) or borrowing (-) | -20.3 | -21.6 | -22.0 | -21.0 | -86.6 | -85.0 |
| In % of GDP | ||||||
| Net lending (+) or borrowing (-) | -3.8 | -4.1 | -4.1 | -3.9 | -4.1 | -4.0 |
In Q4 2014, contributions paid by households sped up slightly (+0.9% after +0.7%). Social benefits kept increasing (+0.8% after +0.9%).
Consumption prices were stable in Q4 (0.0% after –0.1%). All in all, household’s purchasing power declined by 0.2% after increasing in the previous quarter (+0.6%). In 2014, households’ purchasing power rose (+1.1%) after a stagnation in 2013. Taken individually (measured per consumption unit), it grew by 0.4% in 2014 after three years of decline (–0.6% in 2013).
In Q4, houselhold consumption in volume increased by 0.2% whereas purchasing power declined. Thus, the saving ratio decreased by 0.3 points to 15.4%.
Non-financial corporations’ profit ratio increased in Q4 2014
Non-financial corporations’ added value accelerated in Q4 2014 (+0.9% after +0.5%) particularly due to the favorable effect of lower oil prices on input prices. The wages they pay (including social contributions) remained slack (+0.3% after +0.2%). Finally, non-financial corporations’ profit ratio rose by 0.4 points, from 29.5% to 29.9%. Over the year 2014, it held almost steady (29.7% after 29.8%): The favorable effect of the tax credit for encouraging competitiveness and jobs (CICE) was offset by a real wages increase outpacing productivity gains.
In Q4 2014, general government deficit slightly reduced
In Q4 2014, general government net borrowing decreased by 0.2 points, from 4.1% to 3.9% of GDP. General government expenditure rose by 0.3% (or +1.0 billion of euros). At the same time, receipts increased by 0.7% (or 1.9 billions of euros) owing to the growth of taxes on incomes and social contributions. Over the year, deficit stood at 4.0% of GDP after 4.1% in 2013.
Pour en savoir plus
