


Quarterly national accounts in Q1 2015 National accounts in base 2010 - Detailed results
In Q1 2015, French GDP increased sharply (+0.6% after +0.1%), households’ purchasing power and non-financial corporations’ profit ratio accelerated Quarterly national accounts - detailed figures - 1St Quater 2015
In Q1 2015, GDP in volume terms* increased by 0.6% after +0.1% in Q4 2014. The previous estimation (published May 13th, 2015) is thus confirmed.
In Q1 2015, GDP in volume terms* increased by 0.6% after +0.1% in Q4 2014. The previous estimation (published May 13th, 2015) is thus confirmed.
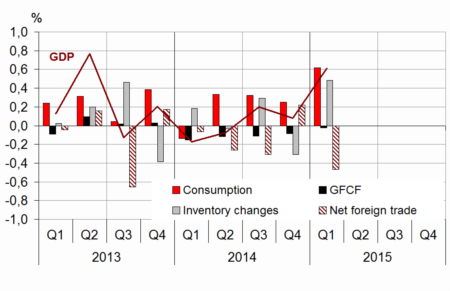
Households’ consumption expenditure accelerated (+0.9% after +0.2%) while gross fixed capital formation (GFCF) decreased again, although more slowly (–0.1% after –0.4%). All in all, final domestic demand (excluding changes in inventories) contributed for +0.6 points to GDP growth (after +0.2 points at the end of 2014).
Imports accelerated (+2.6% after +1.8%), while exports slowed down (+1.1% after +2.8%). Finally, foreign trade contributed negatively to GDP growth (–0.5 points after +0.2 points) and is offset by the positive contribution from changes in inventories (+0.5 points after –0.3 points).
Households’ purchasing power recovered
In nominal terms, households’ gross disposable income (GDI) recovered in Q1 (+1.2% after –0.2%). On the one hand taxes on income and wealth decreased following a strong Q4 (–2.4% after +3.9%), on the other hand wages received by households accelerated sharply (+0.8% after +0.3%).
In Q1 2015, social benefits in cash decelerated (+0.3% after +0.6% at the end of 2014) and contributions paid by households fell back slightly (–0.1% after +0.3% in Q4), specifically those paid by self-employed persons, under the effect of the implementation of the Responsibility and Solidarity Pact.

* This growth rate is seasonally and working-day adjusted; volumes are chain-linked previous-year-prices volumes.
graphiqueGraph1 – GDP and its main components
tableauTab1 – Goods and services:supply and uses chain-linked volumes
| 2014 Q2 | 2014 Q3 | 2014 Q4 | 2015 Q1 | 2014 | 2015 (ovhg) | |
|---|---|---|---|---|---|---|
| GDP | -0.1 | 0.2 | 0.1 | 0.6 | 0.2 | 0.8 |
| Imports | 1.0 | 1.8 | 1.8 | 2.6 | 3.9 | 5.1 |
| Household consumption *expenditure | 0.4 | 0.4 | 0.2 | 0.9 | 0.6 | 1.4 |
| General government's *consumption expenditure | 0.4 | 0.5 | 0.5 | 0.5 | 1.5 | 1.2 |
| GFCF | -0.5 | -0.5 | -0.4 | -0.1 | -1.2 | -0.8 |
| *of which Non-financial corporated and unincorporated enterprises | 0.3 | 0.2 | -0.1 | 0.3 | 2.0 | 0.4 |
| Households | -1.5 | -1.3 | -1.1 | -1.4 | -5.3 | -3.2 |
| General government | -2.8 | -2.1 | -0.3 | 0.4 | -6.9 | -1.6 |
| Exports | 0.1 | 0.9 | 2.8 | 1.1 | 2.4 | 3.7 |
| Contributions : | ||||||
| Internal demand excluding inventory changes | 0.2 | 0.2 | 0.2 | 0.6 | 0.5 | 0.9 |
| Inventory changes | 0.0 | 0.3 | -0.3 | 0.5 | 0.2 | 0.4 |
| Net foreign trade | -0.3 | -0.3 | 0.2 | -0.5 | -0.5 | -0.6 |
tableauTab2 – Sectoral accounts
| 2014 Q2 | 2014 Q3 | 2014 Q4 | 2015 Q1 | 2014 | 2015 (ovhg) | |
|---|---|---|---|---|---|---|
| Profit ratio of NFC* (level) | 29.2 | 29.4 | 29.8 | 31.1 | 29.5 | |
| Household purchasing power | 0.3 | 0.6 | -0.1 | 1.3 | 1.1 | 1.6 |
- *NFC: non-financial corporations
tableauTab3 – Production, consumption and GFCF: main components
| 2014 Q2 | 2014 Q3 | 2014 Q4 | 2015 Q1 | 2014 | 2015 (ovhg) | |
|---|---|---|---|---|---|---|
| Production of branches | 0.0 | 0.4 | 0.1 | 0.8 | 0.7 | 1.1 |
| Goods | -0.2 | 0.7 | -0.3 | 1.6 | 0.1 | 1.7 |
| Manufactured Industry | -0.6 | 0.5 | 0.2 | 1.3 | 0.3 | 1.6 |
| Construction | -1.2 | -1.0 | -0.8 | -0.9 | -2.2 | -2.3 |
| Market services | 0.2 | 0.4 | 0.3 | 0.7 | 1.1 | 1.3 |
| Non-market services | 0.3 | 0.3 | 0.3 | 0.4 | 1.3 | 0.9 |
| Household consumption | 0.4 | 0.4 | 0.2 | 0.9 | 0.6 | 1.4 |
| Food products | 0.6 | -0.2 | 0.4 | 0.2 | 0.2 | 0.5 |
| Energy | 1.7 | 1.0 | -1.6 | 4.0 | -5.7 | 3.6 |
| Engineered goods | 0.0 | 0.3 | 0.6 | 1.6 | 1.9 | 2.2 |
| Services | 0.2 | 0.2 | 0.1 | 0.3 | 0.7 | 0.5 |
| GFCF | -0.5 | -0.5 | -0.4 | -0.1 | -1.2 | -0.8 |
| Manufactured goods | -0.2 | 0.2 | -0.3 | 1.0 | 1.3 | 0.9 |
| Construction | -1.5 | -1.3 | -0.9 | -1.3 | -3.4 | -2.9 |
| Market services | 0.6 | 0.2 | 0.2 | 0.8 | 0.4 | 1.2 |
tableauTab4 – Households’ disposable income and ratios of households’ account
| 2014 Q2 | 2014 Q3 | 2014 Q4 | 2015 Q1 | 2014 | 2015 (ovhg) | |
|---|---|---|---|---|---|---|
| HDI | 0.2 | 0.4 | -0.2 | 1.2 | 1.1 | 1.3 |
| Household purchasing power | 0.3 | 0.6 | -0.1 | 1.3 | 1.1 | 1.6 |
| HDI by cu* (purchasing power) | 0.2 | 0.5 | -0.2 | 1.2 | 0.7 | 1.3 |
| Adjusted HDI (purchasing power) | 0.4 | 0.6 | 0.0 | 1.1 | 1.3 | 1.5 |
| Saving rate (level) | 15.1 | 15.2 | 15.0 | 15.3 | 15.1 | |
| Financial saving rate (level) | 6.0 | 6.2 | 6.0 | 6.5 | 6.0 |
- *cu: consumption unit
tableauTab5 – Ratios of non-financial corporations’ account
| 2014 Q2 | 2014 Q3 | 2014 Q4 | 2015 Q1 | 2014 | |
|---|---|---|---|---|---|
| Profit share | 29.2 | 29.4 | 29.8 | 31.1 | 29.5 |
| Investment ratio | 23.2 | 23.2 | 22.9 | 22.7 | 23.1 |
| Savings ratio | 17.1 | 17.4 | 18.3 | 19.3 | 17.4 |
| Self-financing ratio | 73.6 | 75.0 | 79.9 | 85.2 | 75.2 |
tableauTab6 – Expenditure, receipts and net borrowing of public administrations
| 2014 Q2 | 2014 Q3 | 2014 Q4 | 2015 Q1 | 2014 | |
|---|---|---|---|---|---|
| In billions of euros | |||||
| Total expenditure | 305.7 | 306.9 | 307.4 | 309.8 | 1226.5 |
| Total receipts | 284.4 | 285.5 | 286.4 | 287.9 | 1141.7 |
| Net lending (+) or borrowing (-) | -21.3 | -21.4 | -21.0 | -21.9 | -84.9 |
| In % of GDP | |||||
| Net lending (+) or borrowing (-) | -4.0 | -4.0 | -3.9 | -4.0 | -4.0 |
Consumption prices decreased slightly (–0.1%, as in Q4 2014). All in all, households’ purchasing power bounced back (+1.3% after –0.1% in Q4). Taken individually (measured per consumption unit), it also recovered significantly (+1.2% after –0.2% in Q4).
In Q1 2015, households’ consumption increased (+0.9% after +0.2%) but less sharply than their purchasing power; therefore, their saving ratio increased by 0.3 points and reached 15.3%.
Non-financial corporations’ profit ratio increased
In Q1 2015 non-financial corporations’ (NFCs) value added accelerated (+1.5% after +0.7%) more sharply than the compensations they paid (including social contributions, taxes and subsidy on labour).
NFCs’ social contributions’ rate declined thanks to the Responsibility Pact, and the rate of the tax credit for encouraging competitiveness and jobs (CICE) has been raised. In fine, non-financial corporations’ gross operating surplus accelerated and their profit rate, increasing from 29.8% to 31.1%, reached its highest level since Q1 2011.
In Q1 2015, general government deficit amounted to 4.0% of GDP
In Q1 2015, general government net borrowing increased from 3.9% to 4.0% of GDP and reached 21.9 billion euros.
General government expenditure increased by 0.8% (after +0.2%), owing to the ramp-up of the CICE and as a reaction to a low contribution to the European budget in Q4 2014. Conversely, capital transfers decreased after the payment of the litigation about Ecomouv in Q4.
Receipts kept increasing in Q1 (+0.5% after +0.3%): the rise in corporation tax receipts and in old-age insurance contributions and the higher energy tax rate offset the decline in social contributions implemented within the framework of the Responsibility and Solidarity Pact.
Avertissement
Quarterly national accounts
Quarterly debt of the general government
Sources
Quarterly national accounts
Quarterly accounts are a consistent set of indicators which provides a global overview of recent economic activity.
Time series of the main aggregates of quarterly national accounts can be accessed through the "Summary". They are classified into eight categories:
- Gross domestic product (GDP) and main economic aggregates ;
- Goods and services ;
- Households' consumption ;
- Foreign trade ;
- Activities ;
- Institutional sectors ;
- Households' income and purchasing power ;
- Public finances.
For each category, are available :
- synthetic files displaying from the accounts the relevant information for economic analysis ,
- sometimes, one or two files displaying all the data available.
Documentation
Abbreviated methodology (pdf, 140 Ko )
Methodology - First estimate at 30 days (pdf, 112 Ko )