


Quarterly national accounts in Q1 2015 National accounts in base 2010 - Detailed results
In Q1 2015, French GDP increased strongly: +0.6% after 0.0% Quarterly national accounts - second estimate - 1st quarter 2015
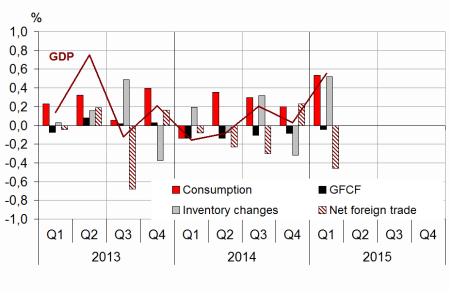
In Q1 2015, GDP in volume terms* increased by 0.6%, after a stability in Q4 2014.
In Q1 2015, GDP in volume terms* increased by 0.6%, after a stability in Q4 2014.
In the three first months of 2015, household consumption expenditure accelerated (+0.8% after +0.1%) while total gross fixed capital formation (GFCF) decreased again (–0.2% after –0.4%). Overall, total domestic demand (excluding inventory changes) increased: it contributed for +0.5 points to GDP growth (after +0.1 points in Q4 2014).
Exports slowed (+0.9% after +2.5%) while imports accelerated (+2.3% after 1.5%). In fine, the foreign trade balance contributed negatively to activity (–0.5 points after +0.2 points in the previous quarter). Conversely, changes in inventories contributed positively: +0.5 points after –0.3 points at the end of 2014.
Total production improved significantly
In Q1 2015, production in goods and services rose by 0.7% after a stagnation at the end of 2014. Output in the manufactured goods accelerated significantly (+1.3% after +0.1%), mainly output of transport equipment (+5.6% after –2.4%). Energy production also bounced back. Production in market services accelerated more moderately (+0.6% after +0.3%). By contrast, activity in construction declined sharply again ( –1.0% after –0.9%).
Household consumption accelerated strongly
In Q1 2015, household consumption expenditure accelerated (+0.8% after +0.1%). In particular, expenditure on energy recovered sharply after exceptionally soft weather conditions in Q4 2014. Consumption in engineered goods also accelerated (+1.4% after +0.5%) thanks to consumption of automobile. Finally, consumption in services remained sluggish (+0.3% after +0.1%).

* This growth rate is seasonally and working-day adjusted; volumes are chain-linked previous-year-prices volumes.
graphiqueGraph1 – GDP and its main components
tableauTab1 – Goods and services:supply and uses chain-linked volumes
| 2014 Q2 | 2014 Q3 | 2014 Q4 | 2015 Q1 | 2014 | 2015 (ovhg) | |
|---|---|---|---|---|---|---|
| GDP | -0.1 | 0.2 | 0.0 | 0.6 | 0.2 | 0.7 |
| Imports | 0.9 | 1.8 | 1.5 | 2.3 | 3.9 | 4.6 |
| Household consumption *expenditure | 0.5 | 0.3 | 0.1 | 0.8 | 0.6 | 1.2 |
| General government's *consumption expenditure | 0.4 | 0.5 | 0.5 | 0.4 | 1.5 | 1.1 |
| GFCF | -0.6 | -0.5 | -0.4 | -0.2 | -1.2 | -0.9 |
| *of which Non-financial corporated and unincorporated enterprises | 0.2 | 0.2 | -0.1 | 0.2 | 2.0 | 0.2 |
| Households | -1.5 | -1.3 | -1.1 | -1.4 | -5.3 | -3.2 |
| General government | -2.8 | -2.1 | -0.3 | 0.3 | -6.9 | -1.7 |
| Exports | 0.2 | 0.9 | 2.5 | 0.9 | 2.4 | 3.2 |
| Contributions : | ||||||
| Internal demand excluding inventory changes | 0.2 | 0.2 | 0.1 | 0.5 | 0.5 | 0.7 |
| Inventory changes | -0.1 | 0.3 | -0.3 | 0.5 | 0.2 | 0.5 |
| Net foreign trade | -0.2 | -0.3 | 0.2 | -0.5 | -0.5 | -0.5 |
tableauTab2 – Sectoral accounts
| 2014 Q2 | 2014 Q3 | 2014 Q4 | 2015 Q1 | 2014 | 2015 (ovhg) | |
|---|---|---|---|---|---|---|
| Profit ratio of NFC* (level) | 29.2 | 29.4 | 29.7 | 29.5 | ||
| Household purchasing power | 0.4 | 0.6 | 0.0 | 1.1 | 0.4 |
- *NFC: non-financial corporations
tableauTab3 – Production, Consumption and GFCF: main components
| 2014 Q2 | 2014 Q3 | 2014 Q4 | 2015 Q1 | 2014 | 2015 (ovhg) | |
|---|---|---|---|---|---|---|
| Production of branches | 0.0 | 0.4 | 0.0 | 0.7 | 0.7 | 0.9 |
| Goods | -0.2 | 0.8 | -0.3 | 1.5 | 0.1 | 1.6 |
| Manufactured Industry | -0.6 | 0.6 | 0.1 | 1.3 | 0.3 | 1.5 |
| Construction | -1.2 | -1.0 | -0.9 | -1.0 | -2.2 | -2.5 |
| Market services | 0.2 | 0.5 | 0.3 | 0.6 | 1.2 | 1.1 |
| Non-market services | 0.3 | 0.3 | 0.3 | 0.4 | 1.3 | 0.8 |
| Household consumption | 0.5 | 0.3 | 0.1 | 0.8 | 0.6 | 1.2 |
| Food products | 0.7 | -0.2 | 0.3 | 0.1 | 0.2 | 0.4 |
| Energy | 1.9 | 1.0 | -1.7 | 3.9 | -5.7 | 3.6 |
| Engineered goods | -0.1 | 0.3 | 0.5 | 1.4 | 1.9 | 1.9 |
| Services | 0.1 | 0.2 | 0.1 | 0.3 | 0.7 | 0.5 |
| GFCF | -0.6 | -0.5 | -0.4 | -0.2 | -1.2 | -0.9 |
| Manufactured goods | -0.1 | 0.2 | -0.3 | 1.2 | 1.3 | 1.1 |
| Construction | -1.5 | -1.3 | -0.9 | -1.3 | -3.4 | -3.0 |
| Market services | 0.3 | 0.2 | 0.2 | 0.4 | 0.4 | 0.7 |
tableauTab4 – Households’ disposable income and ratios of households’ account
| 2014 Q2 | 2014 Q3 | 2014 Q4 | 2015 Q1 | 2014 | 2015 (ovhg) | |
|---|---|---|---|---|---|---|
| HDI | 0.3 | 0.5 | 0.0 | 1.1 | 0.3 | |
| Household purchasing power | 0.4 | 0.6 | 0.0 | 1.1 | 0.4 | |
| HDI by cu* (purchasing power) | 0.3 | 0.5 | -0.1 | 0.7 | 0.3 | |
| Adjusted HDI (purchasing power) | 0.4 | 0.6 | 0.1 | 1.3 | 0.5 | |
| Saving rate (level) | 15.0 | 15.2 | 15.1 | 15.1 | ||
| Financial saving rate (level) | 6.0 | 6.2 | 6.2 | 6.0 |
- *cu: consumption unit
tableauTab5 – Ratios of non-financial corporations’ account
| 2014 Q2 | 2014 Q3 | 2014 Q4 | 2015 Q1 | 2014 | |
|---|---|---|---|---|---|
| Profit share | 29.2 | 29.4 | 29.7 | 29.5 | |
| Investment ratio | 23.2 | 23.2 | 22.9 | 23.1 | |
| Savings ratio | 17.1 | 17.4 | 18.2 | 17.4 | |
| Self-financing ratio | 73.8 | 75.0 | 79.4 | 75.2 |
tableauTab6 – Expenditure, receipts and net borrowing of public administrations
| 2014 Q2 | 2014 Q3 | 2014 Q4 | 2015 Q1 | 2014 | |
|---|---|---|---|---|---|
| In billions of euros | |||||
| Total expenditure | 305.7 | 307.2 | 308.2 | 1226.5 | |
| Total receipts | 284.3 | 285.5 | 286.5 | 1141.7 | |
| Net lending (+) or borrowing (-) | -21.4 | -21.8 | -21.7 | -84.9 | |
| In % of GDP | |||||
| Net lending (+) or borrowing (-) | -4.0 | -4.1 | -4.0 | -4.0 |
Investment declined again
Households’ GFCF decreased again (–1.4% after –1.1%) while enterprises’ improved barely (+0.2% after –0.1%). Product-wise, the decline of construction investment deepened (–1.3% after –0.9%) while investment in manufactured goods (+1.2% after –0.3%) and in market services (+1.5% after +0.1%) accelerated.
Exports slowed, imports accelerated
In Q1 2015, exports slowed (+0.9% after +2.5%), especially in manufactured goods (+1.0% after +3.1%). The slowdown resulted notably from transport equipment (–0.9% after +11.1%). At the same time, imports accelerated sharply (+2.3% after +1.5%), mainly in energy and transportation equipment. Thus, foreign trade weighed down on GDP change this quarter: –0.5 points to GDP after +0.2 points.
Changes in inventories contributed positively to the activity
In Q1 2015, changes in inventories contributed positively to GDP growth: +0.5 points after –0.3 points in Q4 2014. Transport equipment contributed for +0.4 points of GDP, thus overcompensating the contribution of the trade balance of these goods (–0.3 points).
Revisions
Revisions are larger this quarter than on previous publications, but their extent are typical of a first quarter. They come from new benchmarking due to revised annual accounts for years 2012 to 2014 and to updates of seasonal and working day adjustments. In Q3 and Q4 2014, the growth rate of GDP is slightly decreased by 0.1 points each quarter.
Avertissement
Quarterly national accounts
Quarterly debt of the general government
Sources
Quarterly national accounts
Quarterly accounts are a consistent set of indicators which provides a global overview of recent economic activity.
Time series of the main aggregates of quarterly national accounts can be accessed through the "Summary". They are classified into eight categories:
- Gross domestic product (GDP) and main economic aggregates ;
- Goods and services ;
- Households' consumption ;
- Foreign trade ;
- Activities ;
- Institutional sectors ;
- Households' income and purchasing power ;
- Public finances.
For each category, are available :
- synthetic files displaying from the accounts the relevant information for economic analysis ,
- sometimes, one or two files displaying all the data available.
Documentation
Abbreviated methodology (pdf, 140 Ko )
Methodology - First estimate at 30 days (pdf, 112 Ko )