


 19 May 2015
2015- n° 118In April 2015, oil prices accelerated Prices of oil and raw material imports - April 2015
19 May 2015
2015- n° 118In April 2015, oil prices accelerated Prices of oil and raw material imports - April 2015
In April 2015, the price of crude oil in euros increased again (+6.4%), to average 54.9€ per barrel of Brent. Prices of imported commodities except energy in euros decreased (–1.1%), either for raw food materials (-1.9%) or industrial raw materials (-0.5%).
In April 2015, the price of crude oil in euros increased again (+6.4%), to average 54.9€ per barrel of Brent. Prices of imported commodities except energy in euros decreased (–1.1%), either for raw food materials (-1.9%) or industrial raw materials (-0.5%).
Oil prices in euros accelerated
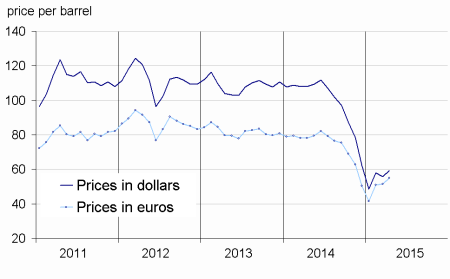
In April, the price of crude oil from the North Sea (Brent) in dollars bounced back (+6.5% after -3.7%), due to a decrease in output anticipations, mostly driven by the fall in rig counts in the United States. In euros, the Brent price went up at the same pace (+6.4% after +1.1%), as the European currency stabilised against the dollar. However, the Brent price remained much lower than the year before (–29.8% in euros).
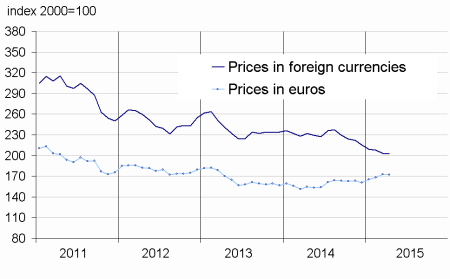
Prices of industrial raw materials dipped
In April, prices of industrial raw materials in euros went down (–0.5% after +2.7% in March), due to a downturn in agricultural raw materials. Year-on-year, prices remained higher (+11.3%), mainly due to the past depreciation of the euro.
Prices of agricultural raw materials fell back (-4.2% after +0.4%), in particular those of hides (-4.9% after +5.4%), of wood pulp (-2.7% after +2.7%), and of tropical wood (-0.3% after +2.6%). Prices of natural fibers decelerated (+3.4% after +4.2%), those of natural rubber as well (+0.3% after +2.9%).
Prices of minerals decelerated (+0.8% after +3.5%), as a result of a slowdown in prices of non-ferrous metals (+2.1% after +4.9%). In particular, nickel prices plummeted (-6.9% after -0.7%), due to a decreasing demand in the steel sector. Prices of iron ore kept tumbling as well (-10.2% after -4.6%, -43% year-on-year). On the other hand, prices of precious metals picked up (+1.9% after -0.1%), in particular those of palladium (+5.5% after -5.5%). Prices of gold accelerated (+1.9% after +0.9%), the precious metal was once again very much in demand in emerging countries.
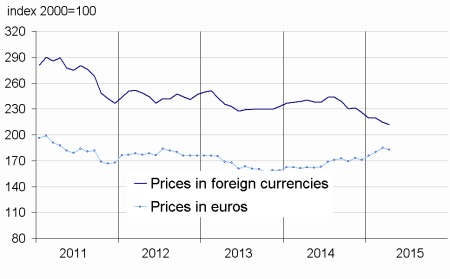
Prices of raw food materials declined
In April, prices of raw food materials in euros fell back (–1.9% after +2.6%), in particular those of cereals (-2.2% after +3.5%), as a result of a decrease in prices of cereals (–2.2% after +3.5%), due to a drop in rice prices. Those of oil seeds and vegetable oils went down as well (–2.7% after +1.7%), in particular those of palm oil (-2.6% after +0.6%), as a result of a high worldwide output facing a lower demand.
tableautabpetrole – Oil and petroleum products
| Prices | Change (%) | |||
|---|---|---|---|---|
| of last month | over the last month | over the last 3 months | over the last 12 months | |
| Brent in $ per barrel | 59.4 | 6.5 | 22.7 | –45.0 |
| Brent in € per barrel | 54.9 | 6.4 | 31.9 | –29.8 |
| Gasoline €/L | 0.42 | 2.2 | 47.2 | –23.7 |
| Gas Oil | 517.8 | 2.8 | 26.3 | –21.2 |
| Heavy fuel | 340.2 | 17.6 | 47.6 | –21.2 |
| Naphtha | 473.0 | 0.9 | 39.8 | –29.5 |
- Prices are in euros per tonne unless otherwise specified
- Source : Insee
tableautabmatprem – Imported raw materials (excluding energy) in euros
| Index | Changes (%) | |||
|---|---|---|---|---|
| of last month | over the last month | over the last 3 months | over the last 12 months | |
| Food total | 221.4 | –1.9 | 3.9 | 13.9 |
| Tropical foodstuffs | 207.6 | –1.1 | 3.3 | 18.4 |
| Oil seeds, vegetable oils | 239.9 | –2.7 | 0.6 | –1.9 |
| Cereals | 159.6 | –2.2 | 3.2 | 10.2 |
| Sugar | 133.8 | 0.7 | –7.7 | –2.9 |
| Beef meat | 190.9 | –1.9 | 11.3 | 42.9 |
| Industrial raw materials | 171.8 | –0.5 | 4.1 | 11.3 |
| Agricultural raw materials | 116.0 | –4.2 | –4.0 | 12.2 |
| Natural Fibers | 126.1 | 3.4 | 13.8 | –0.9 |
| Natural rubber | 168.5 | 0.3 | 4.0 | –10.7 |
| Hides | 104.6 | –4.9 | 1.7 | 12.4 |
| Wood pulp | 108.0 | –2.7 | –0.6 | 19.0 |
| Tropical wood | 115.1 | –0.3 | 5.9 | 13.9 |
| Sawn softwood | 86.8 | –8.7 | –14.1 | –2.0 |
| Minerals | 202.6 | 0.8 | 7.0 | 11.4 |
| Iron ore | 350.1 | –10.2 | –18.4 | –43.0 |
| Non-ferrous metals | 174.7 | 2.1 | 11.0 | 23.3 |
| Precious metals | 255.1 | 1.9 | 3.0 | 15.9 |
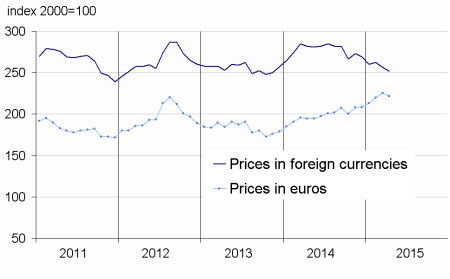
| All commodities | 182.9 | –1.1 | 4.0 | 12.7 |
- Source : Insee
graphiqueG_petrole_ang – Oil
- Source : Insee
graphiqueG_alim_ang – Food
- Source : Insee
graphiqueG_ensemble_ang – All commodities
- Source : Insee
graphiqueG_indus_ang – Industrial raw materials
- Source : Insee
Pour en savoir plus
Time series : Raw materials prices
