


 17 April 2015
2015- n° 91In March 2015, oil prices rose slightly Prices of oil and raw material imports - March 2015
17 April 2015
2015- n° 91In March 2015, oil prices rose slightly Prices of oil and raw material imports - March 2015
In March 2015, the price of crude oil in euros increased again (+1.1%), but more moderately than in February (+22.5%). It averaged 51.6€ per barrel of Brent. Prices of imported commodities except energy in euros climbed (+2.7%), either for raw food materials (+2.6%) or industrial raw materials (+2.7%).

Warning : As usual in March, weights for the current year have been updated, leading to a revision of aggregate price indices since the beginning of the year.
In March 2015, the price of crude oil in euros increased again (+1.1%), but more moderately than in February (+22.5%). It averaged 51.6€ per barrel of Brent. Prices of imported commodities except energy in euros climbed (+2.7%), either for raw food materials (+2.6%) or industrial raw materials (+2.7%).
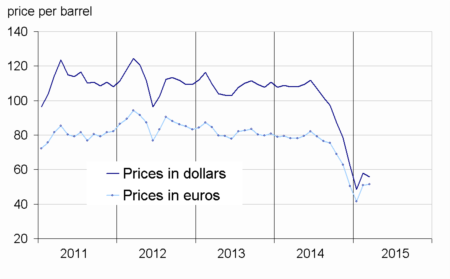
Oil prices in euros went up slightly
In March, the price of crude oil from the North Sea (Brent) in dollars weakened (-3.7% after +19.6%) in a plentiful worldwide output and a high inventory level backdrop in the USA. In euros, the rise in the Brent price was more moderate in March (+1.1%) than in February (+22.5%), the European currency kept depreciating against the dollar (-4.7% in March 2015).
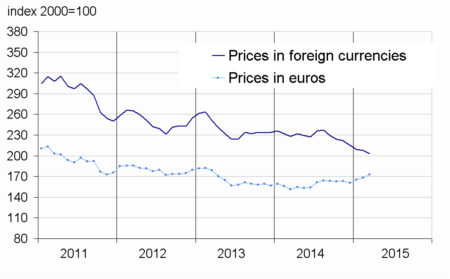
Prices of industrial raw materials remained buoyant
In March, prices of industrial raw materials in euros picked up slightly (+2.7% after +2.4% in February), due to a recovery in agricultural raw materials (+0.4% after -0.2%).
Prices of minerals remained vigorous (+3.5% after +3.4%), in particular those of non-ferrous metals (+4.9% after +5.0%), even though prices of nickel went down (-0.7% after +0.7%), as a result of a weaker expected stainless steel demand in Europe. Prices of precious metals fell back (–0.1% after +0.9%), in particular those of palladium (-5.5% after +8.3%). Finally, prices of iron ore decreased again (–4.6% after -4.7%), on account of a slowing Chinese demand even though the supply in both Brazil and Australia remained dynamic.
Prices of agricultural raw materials recovered (+0.4% after –0.2%), driven by accelerating natural rubber prices (+2.9% after +0.8%), and rallying paper pulp prices (+2.7% after –0.5%). However, prices of tropical wood decelerated (+2.6% after +3.5%), and those of sawn softwood plummeted (-5.2% after –0.8%).
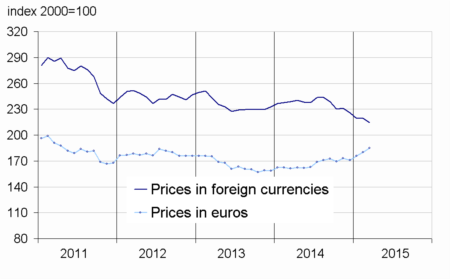
Prices of raw food materials accelerated
In March, prices of raw food materials in euros accelerated (+2.6% after +0.9%), in particular those of cereals (+3.5% after +2.0%), as a result of a downward reassessment of worldwide corn inventories. Prices of oil seeds and vegetable oils picked up (+1.7% after -4.7%). Prices of tropical foodstuffs slowed (+1.4% after +2.9%), due to a marked drop in those of arabica (-8.7% after -6.3%), as a result of a plentiful supply and the depreciation of the Brazilian real against the dollar. The same applied for the prices of sugar (-7.1% after -1.3%) for which Brazil is the world’s leading producer.
tableautabpetrole – Oil and petroleum products
| Prices | Change (%) | |||
|---|---|---|---|---|
| of last month | over the last month | over the last 3 months | over the last 12 months | |
| Brent in $ per barrel | 55.8 | –3.7 | –10.2 | –48.3 |
| Brent in € per barrel | 51.6 | 1.1 | 2.2 | –33.9 |
| Gasoline €/L | 0.41 | 12.0 | 27.6 | –21.3 |
| Gas Oil | 503.7 | 1.2 | 8.3 | –22.8 |
| Heavy fuel | 289.4 | –3.5 | 18.8 | –33.7 |
| Naphtha | 468.9 | 8.3 | 13.5 | –28.7 |
- Prices are in euros per tonne unless otherwise specified
- Source: INSEE
tableautabmatprem – Imported raw materials (excluding energy) in euros
| Index | Change (%) | |||
|---|---|---|---|---|
| over the last month | over the last 3 months | over the last 12 months | ||
| Food total | 225.6 | 2.6 | 8.4 | 15.1 |
| Tropical foodstuffs | 209.8 | 1.4 | 10.1 | 20.3 |
| Oil seeds,vegetable oils | 246.6 | 1.7 | 1.8 | 2.9 |
| Cereals | 163.2 | 3.5 | 9.8 | 10.7 |
| Sugar | 132.9 | –7.1 | –2.5 | –6.6 |
| Beef meat | 194.5 | 6.3 | 18.7 | 36.1 |
| Industrial raw materials | 172.6 | 2.7 | 7.4 | 13.9 |
| Agricultural raw materials | 121.0 | 0.4 | 7.3 | 14.4 |
| Natural Fibers | 121.9 | 4.2 | 14.9 | –6.4 |
| Natural rubber | 168.1 | 2.9 | 3.5 | –16.4 |
| Hides | 110.0 | 5.4 | 10.1 | 19.8 |
| Wood pulp | 111.0 | 2.7 | 8.1 | 22.9 |
| Tropical wood | 115.5 | 2.6 | 9.1 | 15.3 |
| Sawn softwood | 95.0 | –5.2 | –3.8 | 0.4 |
| Minerals | 200.9 | 3.5 | 7.9 | 14.2 |
| Iron ore | 389.8 | –4.6 | –5.8 | –34.9 |
| Non-ferrous metals | 171.1 | 4.9 | 7.9 | 25.8 |
| Precious metals | 250.5 | –0.1 | 14.4 | 11.6 |
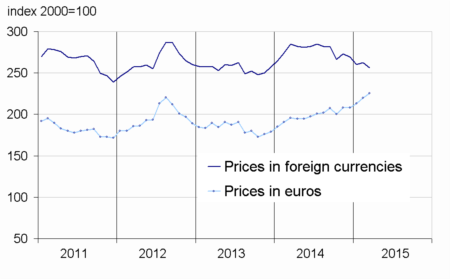
| All commodities | 184.9 | 2.7 | 8.1 | 14,7 |
- Source: INSEE
graphiqueG_petrole_ang – Oil
- Source: INSEE
graphiqueG_alim_ang – Food
- Source: INSEE
graphiqueG_ensemble_ang – All commodities
- Source: INSEE
graphiqueG_indus_ang – Industrial raw materials
- Source: INSEE
Pour en savoir plus
Time series : Raw materials prices
