


 17 February 2015
2015- n° 33In January 2015, oil prices fell back for the seventh month in a row Prices of oil and raw material imports - January 2015
17 February 2015
2015- n° 33In January 2015, oil prices fell back for the seventh month in a row Prices of oil and raw material imports - January 2015
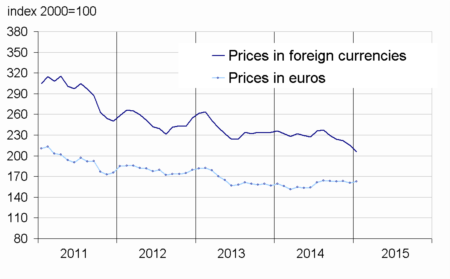
In January 2015, the price of crude oil tumbled again (–17.5%), and averaged €41.6 per barrel of Brent. Prices of imported commodities except energy in euros picked up (+1.7%), due to an increase in prices of agricultural raw materials (+4.1%) and those of raw food materials (+2.5%).
In January 2015, the price of crude oil tumbled again (–17.5%), and averaged €41.6 per barrel of Brent. Prices of imported commodities except energy in euros picked up (+1.7%), due to an increase in prices of agricultural raw materials (+4.1%) and those of raw food materials (+2.5%).
Oil prices kept plunging, bringing the drop to 57% since June 2014
In January, the price of crude oil from the North Sea (Brent) in dollars kept tumbling (–22.1% after –20.8%). Since June 2014, it fell from $111.8 to $48.4, a drop of 57%, down to its lowest level since early 2009. Supply has remained abundant, in particular the U.S. unconventional oil output and that of the OPEC countries. Compared to it, actual and expected demand has remained subdued. In euros, the Brent price dropped a little less (–17.5% after –19.7%), the European currency having depreciated against the U.S. dollar (–5.6% in January 2015).
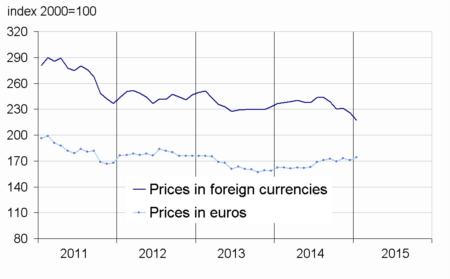
Prices of agricultural raw materials surged
In January, prices of industrial raw materials in euros picked up (+1.2% after –1.8% in December). Prices of agricultural raw materials surged (+4.1% after +0.9%) sustained by accelerating prices of wood pulp (+5.7% after +1.3%) and those of natural fibers (+4.4% after 1.9%). Cotton prices indeed climbed (+4.4% after +2.5%), due to a downward shift in planting intentions. The rebound in prices of hides (+3.0% after –4.8%) and accelerating prices of tropical wood (+2.7 % after +0,4%) also contributed to the increase. However natural rubber prices kept dropping (–0.2% after –6.1%).
Prices of minerals were almost steady (+0.1% after –2.8%). Prices of precious metals ramped up (+9.5% after +2.5%), in the wake of gold prices (+10.5% after +3.4%), and iron ore prices recovered (+3.7% after –4.7%). These are offset by decreasing prices of non-ferrous metals (–1.3% after –2.9%), especially those of copper (–8.4% after –1.1%), owing to a slowing demand from China, the world’s biggest consumer of industrial metals.
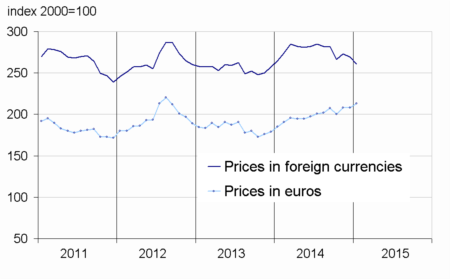
Prices of raw food materials recovered
In January, prices of raw food materials in euros recovered (+2.5% after –0.1%), due to accelerating prices of cereals (+5.0% after +2.1%) and those of tropical foodstuff (+4.3%
after +1.1%). Moreover, prices of sugar (+6.4% after –4.3%) and those of beef meat (+4.6% after –1.7%) rallied. However oil seeds and vegetable oils prices dropped (–1.0% after +0.1%), in particular as a result of falling soya meal prices (–6.7% after –1.4%), despite an upturn in palm oil prices (+8.8% after –4.5%) following heavy flooding in Malaysia.
tableautabpetrole_ang – Oil and petroleum products
| Prices | Change (%) | |||
|---|---|---|---|---|
| of last month | over the last month | over the last 3 months | over the last 12 months | |
| Brent in $ per barrel | 48,4 | –22,1 | –44,5 | –55,0 |
| Brent in € per barrel | 41,6 | –17,5 | –39,5 | –47,3 |
| Gasoline €/L | 0,286 | –11,4 | –38,6 | –41,9 |
| Gas Oil | 409,9 | –11,9 | –31,1 | –38,9 |
| Heavy fuel | 230,4 | –5,4 | –39,2 | –47,4 |
| Naphtha | 338,3 | –18,1 | –41,1 | –50,4 |
- Prices are in euros per tonne unless otherwise specified
- Source: INSEE
tableautabmatprem_ang – Imported raw materials (excluding energy) in euros
| Index | Change (%) | |||
|---|---|---|---|---|
| over the last month | over the last 3 months | over the last 12 months | ||
| Food total | 213,3 | 2,5 | 6,6 | 15,3 |
| Tropical foodstuff | 198,7 | 4,3 | 0,6 | 29,3 |
| Oil seeds, vegetable oils | 239,8 | –1,0 | 11,2 | 2,6 |
| Cereals | 156,0 | 5,0 | 8,8 | 8,0 |
| Sugar | 145,0 | 6,4 | –0,4 | 14,4 |
| Beef meat | 171,5 | 4,6 | 7,7 | 24,6 |
| Industrial raw materials | 162,6 | 1,2 | –0,1 | 2,1 |
| Agricultural raw materials | 117,4 | 4,1 | 5,4 | 8,1 |
| Natural Fibers | 110,8 | 4,4 | 4,1 | –11,8 |
| Natural rubber | 162,0 | –0,2 | –5,0 | –28,8 |
| Hides | 102,8 | 3,0 | –0,7 | 16,7 |
| Wood pulp | 108,6 | 5,7 | 8,9 | 19,8 |
| Tropical wood | 108,7 | 2,7 | 2,9 | 7,9 |
| Sawn softwood | 101,0 | 2,2 | 2,2 | 2,2 |
| Minerals | 186,3 | 0,1 | –2,0 | –0,1 |
| Iron ore | 429,0 | 3,7 | –8,3 | –38,4 |
| Non-ferrous metals | 156,5 | –1,3 | –1,8 | 10,4 |
| Precious metals | 239,8 | 9,5 | 9,7 | 11,5 |
| All commodities | 174,0 | 1,7 | 2,7 | 7,3 |
- Source: INSEE
graphiqueG_petrole_ang – Oil

- Source: INSEE
graphiqueG_alim_ang – Food
- Source: INSEE
graphiqueG_ensemble_ang – All commodities
- Source: INSEE
graphiqueG_indus_ang – Industrial raw materials
- Source: INSEE
Pour en savoir plus
Time series : Raw materials prices
