


 26 February 2015
2015- n° 42The decrease of prices of second-hand dwellings deepened in the fourth quarter 2014
(–1.0% q-o-q, –2.2% y-o-y) Indexes of prices of second-hand dwellings - 4th Quarter 2014
26 February 2015
2015- n° 42The decrease of prices of second-hand dwellings deepened in the fourth quarter 2014
(–1.0% q-o-q, –2.2% y-o-y) Indexes of prices of second-hand dwellings - 4th Quarter 2014
During the fourth quarter 2014, prices of second-hand dwellings went down by 1.0% quarter-on-quarter according to provisional results (s.a. data). The decline accelerated for houses (–1.1%, after –0.5% during Q3), and reduced slightly for flats (–0.8%, after –1.1%).
During the fourth quarter 2014, prices of second-hand dwellings went down by 1.0% quarter-on-quarter according to provisional results (s.a. data). The decline accelerated for houses (–1.1%, after –0.5% during Q3), and reduced slightly for flats (–0.8%, after –1.1%).
Year-on-year, the decrease of prices of second-hand dwellings deepened: –2.2% in the fourth quarter 2014 compared to the fourth quarter 2013, against –1.4% in the third quarter. Prices of flats (–2.3% y-o-y) and of houses (–2.1%) fell in the same proportion.
Prices were still declining in Île-de-France
In Île-de-France, the decline of prices of second-hand dwellings went on during the fourth quarter 2014, almost at the same pace as in the previous quarter (–0.5% q-o-q, –2.0% y-o-y).
The decrease of prices of houses (–0.7% q–o–q, –2.1% y–o–y) was slightly more important than the one for flats (–0.4% q–o–q, –1.9% y–o–y).
Compared to the fourth quarter of 2013, prices of flats in Île-de-France declined more in the outer suburban periphery (around –3.0%) and Paris (–2.1%) than in the inner suburban periphery (between –0.6% and –1.2%).
The decline is more important in provincial France
In provincial France, the decrease of second-hand dwellings accelerated: –1.1% q-o-q, –2.3% y–o–y. Q–o–q, the decline was similar for flats (–1.1%) and houses (–1.2%); y-o-y, the decline was more important for flats (–2.7%) than for houses (–2.1%).
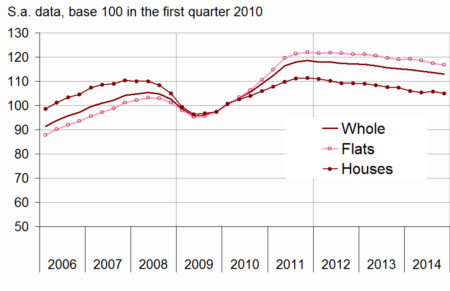
graphiqueGraphique1a – Prices of second-hand dwellings
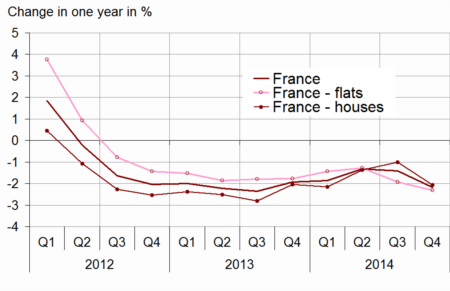
- Insee, French notaries - Database Bien, Perval society
graphiqueGraphique2a – Prices of second-hand dwellings in Île-de-France
- INSEE, French notaries - Database Bien, Perval society
tableauTableau1a – Variation in prices of second-hand dwellings in metropolitan France
| change in | ||||||
|---|---|---|---|---|---|---|
| 3 months (S.A.) | 12 months | |||||
| 2014 Q2 | 2014 Q3 (sd) | 2014 Q4 (p) | 2014 Q2 | 2014 Q3 (sd) | 2014 Q4 (p) | |
| France | -0.2 | -0.8 | -1.0 | -1.3 | -1.4 | -2.2 |
| Flats | -0.4 | -1.1 | -0.8 | -1.3 | -1.9 | -2.3 |
| Houses | 0.0 | -0.5 | -1.1 | -1.4 | -1.0 | -2.1 |
- (p): provisional
- (sd): semi-definitive
- Sources: INSEE, French notaries - Database Bien, Perval society
The annual volume of transactions was still slightly decreasing in the fourth quarter 2014
The annual volume of transactions held steady at the beginning of 2014, after increasing in 2013. However, since June 2014, the number of transactions has been falling: in December, it was estimated at 700 000 over the last 12 months, against 725 000 in September and 734 000 in June.
Year-on-year, the annual number of transactions decreased: –2.4%, compared to the 717 000 transactions completed during 2013.
graphiqueGraphique3a – Volume of transactions of second-hand dwellings over the last 12 months
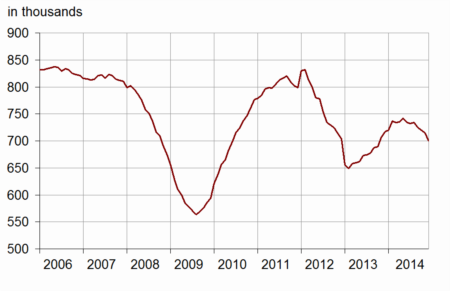
- CGEDD, based on notarial databases and DGFiP (MEDOC)
Revisions
The index is revised to include transactions recorded after the last publication.
In comparison to the results released on 6th January 2015, the change in prices in the third quarter 2014 was revised downwards by 0.2 point for the total, for flats as for houses.
tableauTableau2a – Variation in prices of second-hand dwellings in metropolitan France
| Change in | ||||||
|---|---|---|---|---|---|---|
| 3 months (S.A.) | 12 months | |||||
| 2014 Q2 | 2014 Q3 (sd) | 2014 Q4 (p) | 2014 Q2 | 2014 Q3 (sd) | 2014 Q4 (p) | |
| Metropolitan France | -0.2 | -0.8 | -1.0 | -1.3 | -1.4 | -2.2 |
| - Flats | -0.4 | -1.1 | -0.8 | -1.3 | -1.9 | -2.3 |
| - Houses | 0.0 | -0.5 | -1.1 | -1.4 | -1.0 | -2.1 |
| Île-de-France | -0.5 | -0.6 | -0.5 | -1.9 | -1.9 | -2.0 |
| Provincial France | 0.0 | -0.8 | -1.1 | -1.1 | -1.2 | -2.3 |
| Flats | ||||||
| Île-de-France | -0.5 | -1.1 | -0.4 | -1.5 | -2.0 | -1.9 |
| - Paris | -0.2 | -1.6 | -0.3 | -1.0 | -2.1 | -2.1 |
| - Seine-et-Marne | -1.1 | 0.6 | -1.2 | -3.2 | -2.9 | -2.8 |
| - Yvelines | -0.1 | -1.1 | -1.6 | -2.1 | -2.6 | -2.8 |
| - Essonne | -0.6 | -1.1 | -1.3 | -2.8 | -3.3 | -3.1 |
| - Hauts-de-Seine | -0.8 | -0.9 | -0.2 | -1.5 | -1.4 | -1.2 |
| - Seine-Saint-Denis | -1.4 | -0.7 | 0.4 | -2.0 | -1.5 | -0.6 |
| - Val-de-Marne | -0.8 | -0.7 | -0.1 | -1.5 | -1.2 | -1.1 |
| - Val-d'Oise | -0.3 | -0.6 | -1.5 | -2.7 | -2.6 | -3.1 |
| Provincial France | -0.4 | -1.0 | -1.1 | -1.0 | -1.8 | -2.7 |
| - Conurbation > 10 000 inhabitants | -0.4 | -1.1 | ** | -1.1 | -2.0 | ** |
| - Central town | -0.4 | -1.0 | ** | -0.9 | -1.6 | ** |
| - Suburb | -0.4 | -1.2 | ** | -1.6 | -2.7 | ** |
| - Conurbation < 10 000 inhabitants | -0.2 | -1.1 | ** | 0.3 | -0.3 | ** |
| Houses | ||||||
| Île-de-France | -0.5 | 0.4 | -0.7 | -2.7 | -1.6 | -2.1 |
| - Seine-et-Marne | -0.3 | 0.5 | -0.7 | -2.8 | -2.1 | -2.4 |
| - Yvelines | -0.1 | 0.5 | -0.1 | -2.3 | -1.3 | -1.6 |
| - Essonne | -0.2 | 0.1 | -0.6 | -2.6 | -2.1 | -2.4 |
| - Hauts-de-Seine | -0.6 | 1.7 | -0.9 | -2.0 | 0.9 | -0.6 |
| - Seine-Saint-Denis | -1.2 | -0.5 | -2.4 | -3.4 | -2.7 | -3.7 |
| - Val-de-Marne | -0.9 | 0.2 | -1.2 | -2.9 | -1.7 | -2.4 |
| - Val-d'Oise | -0.9 | 0.3 | -0.6 | -3.2 | -2.3 | -2.4 |
| Provincial France | 0.2 | -0.7 | -1.2 | -1.1 | -0.9 | -2.1 |
| Nord-Pas de Calais | -1.0 | -0.8 | ** | -1.4 | -2.0 | ** |
| - Flats | -0.7 | -3.7 | ** | -1.6 | -4.5 | ** |
| - Houses | -1.1 | -0.2 | ** | -1.4 | -1.5 | ** |
| - Lille Houses | -0.4 | -0.3 | ** | -0.1 | -0.3 | ** |
| Provence-Alpes-Côte d'Azur | 0.0 | -1.0 | ** | -2.3 | -2.0 | ** |
| - Flats | -0.3 | -0.7 | ** | -1.2 | -2.1 | ** |
| - Houses | 0.4 | -1.4 | ** | -3.4 | -1.9 | ** |
| - Marseille Flats | -1.8 | -2.6 | ** | -1.9 | -5.5 | ** |
| Rhône-Alpes | -0.1 | -1.2 | ** | 0.2 | -0.8 | ** |
| - Flats | -0.4 | -1.1 | ** | -0.5 | -1.2 | ** |
| - Houses | 0.2 | -1.3 | ** | 1.0 | -0.4 | ** |
| - Lyon Flats | -0.6 | -0.8 | ** | -0.3 | 0.5 | ** |
- ** index released on the 7th April 2015
- (p): provisional
- (sd): semi-definitive
- Sources: INSEE, French notaries - Database Bien, Perval society
Pour en savoir plus
