


 25 March 2015
2015- n° 70In March 2015, the business climate is virtually stable in services Monthly survey of services - March 2015
25 March 2015
2015- n° 70In March 2015, the business climate is virtually stable in services Monthly survey of services - March 2015
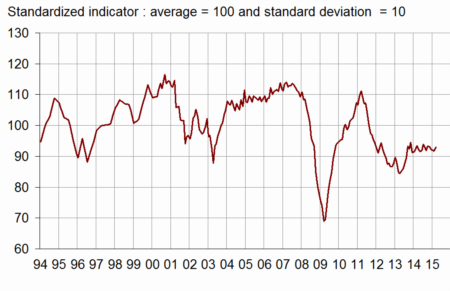
According to business managers, the business climate in services is virtually stable in March 2015. The business climate composite indicator increases by one point and stands at 93, still below its long-term average (100). The turning point indicator still indicates a favorable dynamic.
All services
According to business managers, the business climate in services is virtually stable in March 2015. The business climate composite indicator increases by one point and stands at 93, still below its long-term average (100). The turning point indicator still indicates a favorable dynamic.
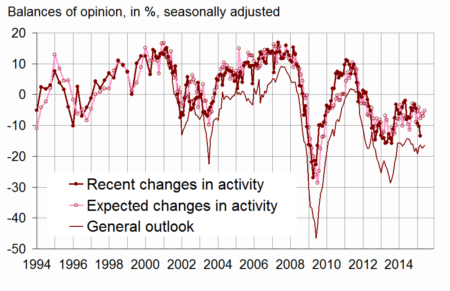
The balance on the general outlook, which relates the assessment of business leaders over their whole sector, is practically stable and remains far below its long-term average.
graphiqueGraph1 – Composite indicator
graphiquegraph_retourn – Turning point indicator
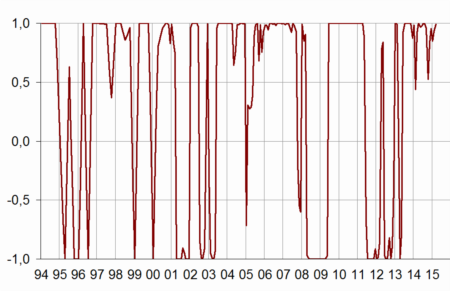
- Note: close to 1 (respectively -1), this indicator indicates a favorable short-term economic situation (respectively unfavorable).
The balance of opinion on past activity has decreased again and deviates further from its long-term average. By contrast, business leaders’ expectations on activity and demand are more optimistic than in February. Nevertheless, the corresponding balances remain clearly below their long-term average.
The balance of opinion on past employment has deteriorated whereas the balance on expected employment is steady. Both of the balances are below their long-term average.
tableauTable_quarter – Economic outlook in the services sector
| Average* | Dec. 14 | Jan. 15 | Feb. 15 | March 15 | |
|---|---|---|---|---|---|
| Composite indicator | 100 | 92 | 92 | 92 | 93 |
| General outlook | –8 | –16 | –17 | –17 | –16 |
| Past activity | 2 | –4 | –9 | –10 | –13 |
| Expected activity | 2 | –8 | –6 | –7 | –5 |
| Expected demand | –1 | –9 | –8 | –8 | –6 |
| Business situation | –3 | –8 | –11 | –9 | –9 |
| Past selling prices | –4 | –11 | –10 | –12 | –12 |
| Expected selling prices | –2 | –12 | –13 | –9 | –10 |
| Past employment | 2 | –2 | –6 | –2 | –7 |
| except temporary work agencies | 1 | –1 | –5 | –1 | –6 |
| Expected employment | 2 | 0 | –6 | –2 | –2 |
| except temporary work agencies | –1 | –3 | –8 | –5 | –6 |
| Investments | |||||
| Past investments | 1 | –5 | –4 | –4 | –1 |
| Expected investments | 1 | 1 | 0 | 0 | –3 |
- * Average of the balances of opinion since 1988
- Source: Insee
graphiqueGraph2 – Activity
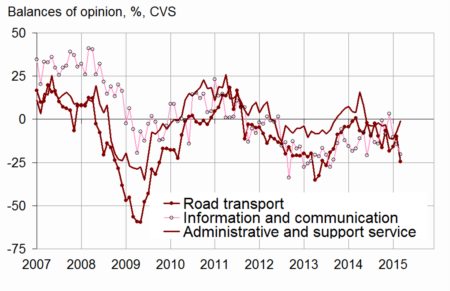
Road transport
In road freight and mail activities much more business leaders have indicated that their past activity has declined. The expectations on activity and demand remain deteriorated. The balance on past employment has gone down and stands below its long-term average.
Accommodation and food service activities
In accommodation and food service activities, the balances of opinion on past and expected activity have deteriorated again. The expectations on demand have also fallen back but the corresponding balance stays above its long-term average.
Information and communication
In information and communication, the balance of opinion on past activity has fallen again and deviates further from its long-term average. Nevertheless, business leader’s expectations on activity are more optimistic than in February even if the corresponding balance remains below its long-term average. The balance on expected demand is practically stable.
Real estate
In real estate, the balances of opinion on past activity, expected activity and expected demand have increased slightly and come closer to their long-term average. The balance on expected employment remains above its long-term level.
Professional, scientific and technical activities
In professional, scientific and technical activities, business leaders stay more pessimistic than in average on past and expected activity and on expected demand. The balances on past and expected employment have gone down and become negative.
Administrative and support service activities
In administrative and support service activities, business leaders are more optimistic on past activity, expected activity and expected demand. More of them consider that the past employment has decreased and that the employment will increase significantly in the next three months.
graphiquegraph_bonus_ – Past activity
tableauTable_det – Detailed data
| A21 | Average* | Dec. 14 | Jan. 15 | Feb. 15 | March 15 |
|---|---|---|---|---|---|
| (H) Road transport | |||||
| Past activity | –8 | –18 | –16 | –10 | –25 |
| Expected activity | –10 | –10 | –20 | –24 | –21 |
| Expected demand | –13 | –17 | –23 | –24 | –23 |
| Past employment | –8 | –4 | –5 | –4 | –12 |
| Expected employment | –11 | –4 | –15 | –14 | –16 |
| (I) Accommodation and food service activities | |||||
| Past activity | –7 | –10 | –14 | –17 | –26 |
| Expected activity | –7 | –5 | –9 | –10 | –13 |
| Expected demand | –9 | –11 | –8 | –1 | –4 |
| Past employment | –4 | –2 | –8 | –9 | –18 |
| Expected employment | –6 | –9 | –13 | –18 | –13 |
| (J) Information and communication | |||||
| Past activity | 9 | 3 | –10 | –14 | –20 |
| Expected activity | 10 | –18 | –5 | –6 | 3 |
| Expected demand | 11 | –10 | 4 | 5 | 4 |
| Past employment | 6 | 0 | 2 | –2 | –3 |
| Expected employment | 11 | 1 | –5 | 1 | 0 |
| (L) Real estate activities | |||||
| Past activity | 7 | 8 | 7 | 0 | 1 |
| Expected activity | 7 | 3 | 3 | 1 | 5 |
| Expected demand | 1 | –1 | –4 | –4 | –1 |
| Past employment | 3 | 0 | –1 | 3 | 0 |
| Expected employment | 2 | –3 | 6 | 4 | 6 |
| (M) Professional, scientific and technical activities | |||||
| Past activity | –1 | –8 | –9 | –11 | –12 |
| Expected activity | –2 | –12 | –12 | –11 | –13 |
| Expected demand | –6 | –15 | –14 | –20 | –17 |
| Past employment | 1 | 2 | 0 | 2 | –5 |
| Expected employment | 0 | –4 | –1 | 1 | –4 |
| (N) Administrative and support service activities | |||||
| Past activity | 6 | –11 | –11 | –7 | –1 |
| Expected activity | 5 | 3 | –4 | –3 | 3 |
| Expected demand | 3 | 1 | –7 | –10 | –2 |
| Past employment | 8 | –2 | –8 | 0 | –7 |
| Expected employment | 6 | 7 | –3 | 1 | 7 |
- * Average of the balances of opinion since 1988 (2006 for road transport)
Documentation
Methodology (2016) (pdf,158 Ko)
Pour en savoir plus
Time series : Economic outlook surveys – Services
