


 19 December 2014
2014- n° 293In December 2014, the business climate is almost stable in the retail trade and in
the trade and repair of motor vehicles Monthly survey of retailing - December 2014
19 December 2014
2014- n° 293In December 2014, the business climate is almost stable in the retail trade and in
the trade and repair of motor vehicles Monthly survey of retailing - December 2014
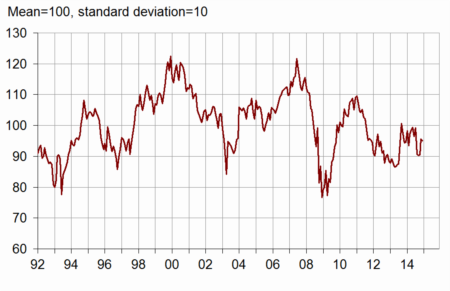
According to the managers surveyed in December 2014, the business climate is almost stable in the retail trade and in the trade and repair of motor vehicles. The corresponding synthetic indicator has lost one point, still remaining under its long-term average.
According to the managers surveyed in December 2014, the business climate is almost stable in the retail trade and in the trade and repair of motor vehicles. The corresponding synthetic indicator has lost one point, still remaining under its long-term average.
graphiquegraph_indsynt_en – Business climate synthetic indicator
Less pessimistic past activity
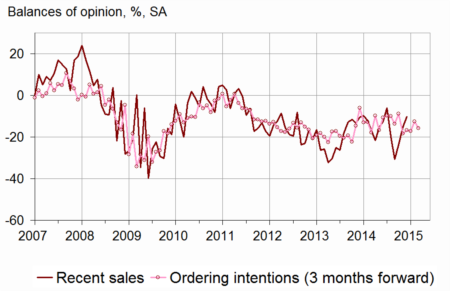
For the three straight months, fewer business leaders have declared a fall in their past sales. The corresponding balance of opinion has got nearer its average. About expectations, the balance concerning expected sales has gone on progressing, the ordering intentions one has declined, and the general outlook one has stabilised. Each of the three has remained under its average.
Stocks have been estimed higher for four months. They are significantly over their standard level from now on.
For the the two straight months, fewer business leaders have anticipated a fall in selling prices. The corresponding balance is nevertheless still low.
graphiqueGraph_ventes_ic_en – Recent sales and ordering intentions
tableautab1_en – Global data
| Ave. (1) | Sept. 14 | Oct. 14 | Nov. 14 | Dec. 14 | |
|---|---|---|---|---|---|
| Business climate | 100 | 90 | 90 | 96 | 95 |
| General business outlook | –30 | –42 | –41 | –37 | –37 |
| Recent sales | –8 | –31 | –24 | –15 | –10 |
| Expected sales | –3 | –15 | –12 | –9 | –7 |
| Ordering intentions | –9 | –17 | –17 | –12 | –16 |
| Stocks | 11 | 7 | 8 | 11 | 18 |
| Past selling prices (2) | –6 | –16 | –24 | ||
| Expected selling prices | –3 | –15 | –15 | –12 | –10 |
| Cash position (2) | –15 | –19 | –22 | ||
| Workforce size: recent trend | 0 | –2 | –4 | –7 | –4 |
| Workforce size: future trend | –2 | –11 | –13 | –9 | –6 |
- (1) Average since 1991 (2004 for recent and expected sales and ordering intentions).
- (2) Bi-monthly question (odd-numbered months).
- Source: monthly survey in the retail trade and in the trade and repair of motor vehicles - INSEE
A little better employment
Each of both balances concerning past and expected prices has increased, but has remained under its average.
Retail trade
Past activity is estimed better in non-specialised trade, more grim in specialised sector
According to non-specialised retailers, recent sales have progressed again in this sector, the corresponding balance going over its average. On the other hand, specialised retailers have indicated a drop in their past activity for the third month in a row, the balance becoming very low.
About their forecasts, retailers have had different opinions: fewer of them have declared a decrease in their expected sales, mainly in non-specialised trade. On the opposite, more of them have anticipated a decline in ordering intentions.
In the home supplies sector, the traders have notified specially sluggish past and expected activities.
Stocks have been considered very high, principally in non-specialised trade. The balance is at the level of the end of 2011 again.
In non-specialised trade, fewer retailers than in November have expected a fall in prices.
Trade and repair of motor vehicles
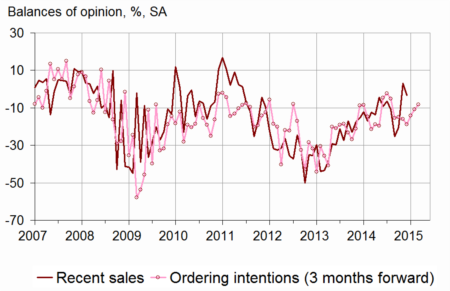
graphiquegraph_ventes_ic_auto_en – Recent sales and ordering intentions in motor vehicles
Balnces concerning activity above their averages
According to managers in the trade and repair of motor vehicles, past and expected sales have slightly declined, but ordering intentions have improved: each of the three balances has been over its average.
The level of stocks is considered gradually higher, getting near its standard level.
More vehicles leaders than in November have anticipated drops in prices.
tableautab2_en – Detailed data
| Ave. (1) | Sept. 14 | Oct. 14 | Nov. 14 | Dec. 14 | |
|---|---|---|---|---|---|
| Retail trade - Global data | |||||
| Recent sales | –6 | –33 | –25 | –22 | –13 |
| Expected sales | –1 | –14 | –12 | –13 | –8 |
| Ordering intentions | –7 | –15 | –18 | –13 | –19 |
| Stocks | 10 | 6 | 8 | 11 | 20 |
| Past selling prices (2) | –8 | –19 | –31 | ||
| Expected selling prices | –5 | –19 | –19 | –18 | –15 |
| Cash position (2) | –13 | –19 | –20 | ||
| Workforce size: recent trend | 1 | 1 | –3 | –5 | –3 |
| Workforce size: future trend | –2 | –12 | –12 | –10 | –6 |
| Non-specialized retail trade | |||||
| Recent sales | –2 | –44 | –26 | –14 | 5 |
| Expected sales | 5 | –10 | 0 | –4 | 9 |
| Ordering intentions | 1 | –12 | –9 | –3 | –17 |
| Stocks | 7 | 3 | 4 | 6 | 22 |
| Past selling prices (2) | –8 | –24 | –38 | ||
| Expected selling prices | –5 | –29 | –23 | –16 | –9 |
| Cash position (2) | –7 | –13 | –14 | ||
| Specialized retail trade | |||||
| Recent sales | –10 | –19 | –24 | –33 | –35 |
| Expected sales | –8 | –17 | –21 | –15 | –21 |
| Ordering intentions | –17 | –21 | –24 | –19 | –24 |
| Stocks | 14 | 10 | 13 | 16 | 17 |
| Past selling prices (2) | –8 | –12 | –23 | ||
| Expected selling prices | –5 | –6 | –13 | –20 | –22 |
| Cash position (2) | –22 | –27 | –28 | ||
| Trade and repair of motor cars and motorcycles | |||||
| Recent sales | –11 | –25 | –20 | 3 | –3 |
| Expected sales | –10 | –19 | –10 | –1 | –4 |
| Ordering intentions | –14 | –19 | –14 | –11 | –8 |
| Stocks | 15 | 7 | 8 | 13 | 14 |
| Past selling prices (2) | 1 | –7 | –8 | ||
| Expected selling prices | 4 | –3 | –2 | 3 | –1 |
| Cash position (2) | –26 | –20 | –24 | ||
| Workforce size: recent trend | –10 | –11 | –7 | –12 | –13 |
| Workforce size: future trend | –8 | –11 | –11 | –9 | –8 |
- (1) Average since 1991 (2003 for trade and repair of motor vehicles and 2004 for recent and expected sales and ordering intentions).
- (2) Bi-monthly question (odd-numbered months).
- Source: monthly survey in the retail trade and in the trade and repair of motor vehicles - INSEE
Documentation
Methodology (pdf,129 Ko)
Pour en savoir plus
