


 27 February 2015
2015- n° 47Overall agricultural producer prices stability in january 2015 Indices of agricultural prices - January 2015
27 February 2015
2015- n° 47Overall agricultural producer prices stability in january 2015 Indices of agricultural prices - January 2015
In January 2015, overall agricultural producer prices were stable; over one year they dropped by 4.0 %.
In January 2015, overall agricultural producer prices were stable; over one year they dropped by 4.0 %.
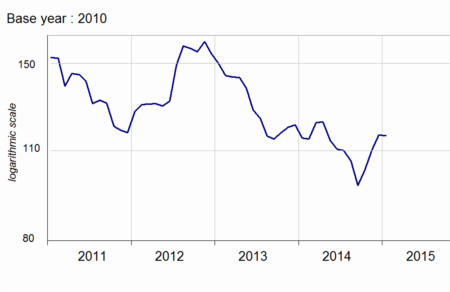
Cereal prices stabilized in January after the rally of the three last previous month. The abundant supply weighed on prices but was offset by bullish factors: the decline of the euro against the dollar supported the euro prices, the war in Ukraine resulted in a reduction in the international supply and taxation by Russia of wheat exports made the international prices react upwardly.
graphiquecereal – Producer prices of cereals
- Source : Insee
In January oilseed prices rose (+ 2.3% after 2.7%). The price of rapeseed increases mainly due to the decline in the euro and to anticipations of the next crop at a low level in Europe.
Wine prices increased by 1.5 % over one year. The last crop was normal, except in the Languedoc-Roussillon region which was struck by bad weather. So, the prices of common wines, massively produced in this region, rose significantly (+14.4 % over one year).
Potato prices tumbled compared to last year (–38.5 %): the crops in North-Western Europe looked more abundant than last year, due to better yields and the rise in areas under cultivation.
Fresh fruits prices went down in December (-5.3 % over one year). Apples and pears prices decreased : the commercial Russian embargo, estabished last August, led to the saturation of the other European markets.
graphiquevegetable – Producer prices of vegetables
- Source : SSP (ministry of agriculture)
Prices for fresh vegetables surged in January (+20.3% over one year after-0.2%). Endive prices rose sharply due to the reduction by one third in planted areas. Salads prices also increased: the weather conditions in the South-East, the main producing region in winter, reduced yields. The cauliflower prices also went up due to strong demand coupled with the decline in production.
graphiquepig – Producer prices of pigs and large cattle
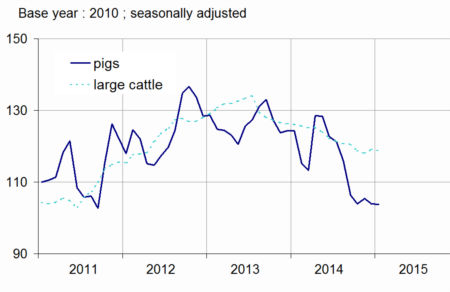
On a seasonally adjusted basis, animal prices were virtually unchanged in January (-0.2%). They fell by 7.5% year on year. Pork prices tumbled (-16.5% year over year) due to the sanitary Russian embargo established in January 2014. The price of poultry decreased year on year (-6.0%) under the pressure of foreign competition. On the contrary, the price of sheep increased year-over-year (+ 3.4%), due to the decline in global production in particular from Oceania. The price of milk decreased (-8.9% yoy) due to the loss of the Russian market since August for dairy products and to the worldly rise in milk production.
tableauTab1 – Indices of producer prices of agricultural products (IPPAP)
| Variation as % over | ||||||
|---|---|---|---|---|---|---|
| weights | Jan. 2015 | a month | 3 months | a year | ||
| raw | Seasonally adjusted | raw | ||||
| Agricultural goods output | 1000 | 113.7 | 0.0 | +2.4 | –4.0 | |
| excluding fruits and vegetables | 900 | 114.8 | –0.4 | +2.0 | –5.0 | |
| Crop output (excluding fruits and vegetables) | 505 | 116.0 | –0.2 | +4.6 | –3.0 | |
| Cereals | 188 | 116.1 | –0.1 | +13.1 | +0.9 | |
| of which soft wheat | 112 | 115.1 | +1.2 | +17.2 | –1.4 | |
| grain maize | 41 | 92.2 | –3.3 | +9.4 | –11.1 | |
| Potatoes | 26 | 94.6 | /// | /// | –38.5 | |
| Wines | 177 | 129.1 | –0.5 | –1.9 | +1.5 | |
| Protected designation of origin | 84 | 133.2 | –1.2 | –2.1 | –1.3 | |
| other wines | 23 | 148.4 | +1.0 | +2.7 | +14.4 | |
| Oleaginous | 49 | 95.5 | +2.3 | +10.4 | –1.0 | |
| Horticultural products | 30 | 108.5 | –0.7 | –0.7 | –1.3 | |
| Other crop products | 36 | 119.1 | –1.0 | +0.7 | –1.7 | |
| Fruits and vegetables (1) | 100 | 104.0 | /// | /// | +7.3 | |
| Fresh vegetables | 53 | 100.6 | /// | /// | +20.3 | |
| Fresh fruits | 35 | 105.7 | /// | /// | –5.3 | |
| Animal output | 395 | 113.1 | –0.7 | –1.1 | –7.4 | |
| Animals | 234 | 110.0 | –0.2 | –0.2 | –7.5 | |
| of which large cattle | 96 | 116.5 | –0.3 | 0.0 | –5.6 | |
| calves | 26 | 110.9 | –1.4 | +2.7 | –3.4 | |
| pigs | 54 | 96.2 | 0.0 | –0.1 | –16.5 | |
| sheep | 10 | 123.2 | +0.2 | +3.2 | +3.4 | |
| poultry | 46 | 108.8 | 0.0 | –3.3 | –6.0 | |
| of which chicken | 28 | 108.7 | +0.2 | –3.5 | –6.0 | |
| Milk | 147 | 116.8 | 0.0 | –3.7 | –8.9 | |
| of which cow milk (2) | 137 | 117.0 | 0.0 | –4.0 | –9.6 | |
| Eggs | 15 | 126.3 | –12.0 | +12.0 | +10.9 | |
- (1) Including vegetables for industry.
- (2) The price for January is not yet known and therefore is estimated by carrying forward the seasonally adjusted price from December
Overall purchase prices of the means of agricultural production virtually unchanged
In January, intermediate consumptions prices have been slipping for nine months (–4,6 %). Energy prices fell by almost 20 % over one year. Feed prices increased a little in January (+0.4 %) but noticeably decreased over one year (–7.2 %). Investment goods prices were virtually stable this month (+0.1 %).
graphiquemeans – Purchase price of the means of agricultural production
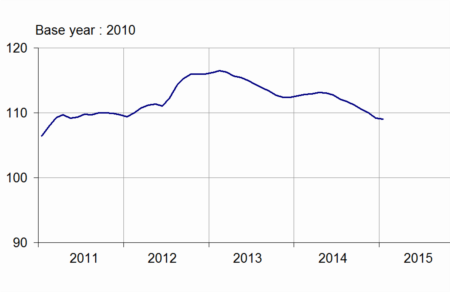
- Sources : Insee - SSP (ministry of agriculture)
tableauTab2 – Indices of purchase prices of the means of agricultural production (IPAMPA)
| weights | Jan. 2015 | Variation as % over | |||
|---|---|---|---|---|---|
| a month | 3 months | a year | |||
| Total input | 1000 | 109.0 | –0.1 | –1.3 | –3.2 |
| Intermediate consumptions | 764 | 110.0 | –0.2 | –1.8 | –4.0 |
| Energy | 100 | 95.5 | –5.1 | –15.0 | –19.8 |
| Seeds | 57 | 108.7 | +0.4 | +0.3 | +0.3 |
| Fertilisers and soil improvers | 92 | 119.6 | +1.8 | +3.2 | +4.9 |
| Plant protection products | 78 | 99.7 | –0.6 | –1.6 | –0.6 |
| Animal feed | 205 | 116.8 | +0.4 | –0.8 | –7.2 |
| Veterinary expenses | 43 | 113.2 | +0.8 | +0.9 | +2.2 |
| Small equipment and tools | 17 | 108.1 | –1.7 | –1.5 | –0.6 |
| Maintenance of materials | 67 | 112.3 | +0.5 | +0.7 | +1.4 |
| Maintenance of buildings | 9 | 106.9 | 0.0 | –0.2 | 0.0 |
| Other goods and services | 97 | 101.8 | +0.1 | +0.1 | +0.1 |
| Goods and services contributing to investment | 236 | 106.3 | +0.1 | +0.2 | –0.4 |
| Material | 186 | 106.6 | +0.1 | +0.3 | –0.2 |
| Tractors | 79 | 106.1 | +0.4 | +0.2 | –1.3 |
| Machinery and plant for cultivation | 36 | 109.0 | 0.0 | +1.2 | +1.5 |
| Machinery and plant for harvesting | 42 | 106.7 | –0.2 | +0.1 | –0.2 |
| Utility vehicles | 18 | 104.9 | –0.2 | 0.0 | +1.6 |
| Buildings | 50 | 105.0 | 0.0 | –0.4 | –1.5 |
- (1) The repayment of the domestic tax on energy products (TICPE) benefiting farmers has been applied in advance for the year 2015
- Sources: Insee - SSP (ministry of agriculture)
Documentation
Methodology (pdf,122 Ko)
Pour en savoir plus
Time series : Indices of agricultural prices
