


 19 December 2014
2014- n° 296In November 2014, oil prices kept tumbling down Prices of oil and raw material imports - November 2014
19 December 2014
2014- n° 296In November 2014, oil prices kept tumbling down Prices of oil and raw material imports - November 2014
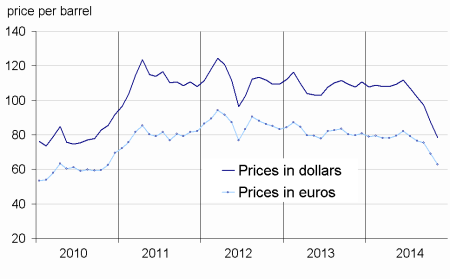
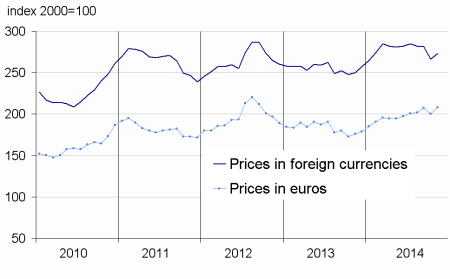
In November 2014, the price of crude oil declined sharply again (-8.7%), and averaged €62.9 per barrel of Brent. Prices of imported commodities except energy in euros bounced back (+2.4%), whether for food materials (+4.1%), industrial raw materials (+1.1%) or minerals (+1.4%).
In November 2014, the price of crude oil declined sharply again (-8.7%), and averaged €62.9 per barrel of Brent. Prices of imported commodities except energy in euros bounced back (+2.4%), whether for food materials (+4.1%), industrial raw materials (+1.1%) or minerals (+1.4%).
Oil prices slumped again, bringing the drop to 35% since June
In November, the price of crude oil from the North Sea (Brent) in dollars kept tumbling (-10.1% after -10.3%). Since June, it has strongly decreased (-35% from June to November). Supply has remained abundant, in particular the American non-conventional oil output and that of the OPEC countries. Compared to it, actual and expected demand has remained subdued. In euros, the Brent price dropped at the same rate as in October (-8.7% after -8.7%), the European currency having depreciated against the U.S. Dollar again (–1.5%).
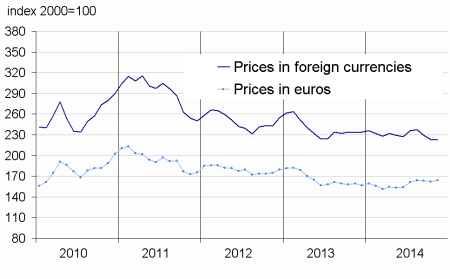
Prices of industrial raw materials recovered
In November, prices of industrial raw materials in euros picked up (+1.1% after -0.9% in October). Prices of agricultural raw materials decelerated slightly (+0.4% after +0.5%): prices of natural rubber bounced back (+1.5% after -2.9%), but remained low (-30.0% year-on-year). Those of natural fibers dipped again (-2.3% after -1.9%). Indeed, prices of cotton continued to fall (-2.5% after -2.4%), as a result of a sluggish demand, particularly in China, while American and Indian supply were high. Prices of tropical wood (-0.3% after +0.3%) and sawn softwood (-2.2% after –0.8%) weakened. Prices of minerals recovered (+1.4% after –1.4%), mainly sustained by aluminum prices (+7.6% after –1.0%), that rallied as a result of an increased demand from the car industry. However, prices of iron ore continued to fall (-7.3%; -42% year-on-year). Prices of copper (-3.2% after +3.3%) and gold (-2.3% after +0.8%) lessened.
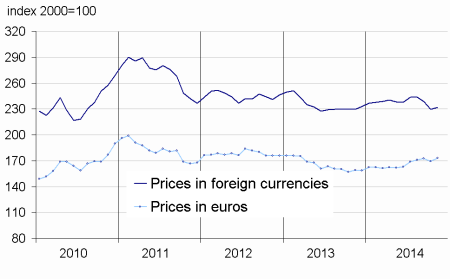
Prices of raw food materials picked up
In November, prices of raw food materials in euros recovered (+4.1% after -3.7%), with a marked upturn in prices of oil seeds and vegetable oils (+12.3% after -16.2%): prices of soybeans soared (+10.3% after -8.8%), boosted by high Chinese imports, notably coming from the USA. On the other hand, prices of sugar dropped (-2.1% after +14.9%). Those of tropical foodstuffs slid sharply (-4.7% after +1.9%), as a result of plentiful cocoa harvest expectations in Western Africa and Ecuador.
tableautabpetrole – Oil and petroleum products
| Prices | Change (%) | |||
|---|---|---|---|---|
| of last month | over the last month | over the last 3 months | over the last 12 months | |
| Brent in $ per barrel | 78.4 | –10.1 | –23.0 | –27.2 |
| Brent in € per barrel | 62.9 | –8.7 | –18.0 | –21.2 |
| Gasoline €/L | 0.42 | –10.1 | –21.8 | –10.3 |
| Gas Oil | 567.1 | –4.7 | –13.2 | –16.5 |
| Heavy fuel | 327.4 | –13.6 | –26.1 | –26.2 |
| Naphtha | 511.3 | –10.9 | –21.8 | –25.7 |
- Prices are in euros per tonne unless otherwise specified
- Source: Insee
tableautabmatprem – Imported raw materials (excluding energy) in euros
| Index | Changes (%) | |||
|---|---|---|---|---|
| over the last month | over the last 3 months | over the last 12 months | ||
| Food total | 208.3 | 4.1 | 3.1 | 18.1 |
| Tropical foodstuffs | 188.4 | –4.7 | –0.6 | 30.3 |
| Oil seeds. vegetable oils | 242.0 | 12.3 | 0.0 | 5.9 |
| Cereals | 145.6 | 1.5 | 4.3 | –1.6 |
| Sugar | 142.5 | –2.1 | 6.5 | –3.2 |
| Beef meat | 166.7 | 4.6 | 11.8 | 40.8 |
| Industrial raw materials | 164.0 | 1.1 | –0.1 | 3.1 |
| Agricultural raw materials | 111.7 | 0.4 | 3.1 | 2.8 |
| Natural Fibers | 104.0 | –2.3 | –2.1 | –12.7 |
| Natural rubber | 173.1 | 1.5 | –4.6 | –30.0 |
| Hides | 104.9 | 1.3 | 8.6 | 16.0 |
| Wood pulp | 101.4 | 1.7 | 7.1 | 12.6 |
| Tropical wood | 105.4 | –0.3 | 0.7 | 5.9 |
| Sawn softwood | 96.6 | –2.2 | –1.4 | –5.4 |
| Minerals | 192.1 | 1.4 | –1.2 | 3.1 |
| Iron ore | 433.9 | –7.3 | –15.8 | –42.0 |
| Non-ferrous metals | 163.9 | 3.3 | 2.3 | 18.0 |
| Precious metals | 213.7 | –2.2 | –7.6 | –3.2 |
| All commodities | 173.1 | 2.4 | 1.2 | 8.9 |
- Source: Insee
graphiqueG_petrole_ang – Oil
- Source: Insee
graphiqueG_alim_ang – Food
- Source: Insee
graphiqueG_ensemble_ang – All commodities
- Source: Insee
graphiqueG_indus_ang – Industrial raw materials
- Source: Insee
Pour en savoir plus
Time series : Raw materials prices
