


 27 February 2015
2015- n° 44In January 2015, household consumption expenditure on goods increased again (+0.6%) Household consumption expenditure on goods - January 2015
27 February 2015
2015- n° 44In January 2015, household consumption expenditure on goods increased again (+0.6%) Household consumption expenditure on goods - January 2015
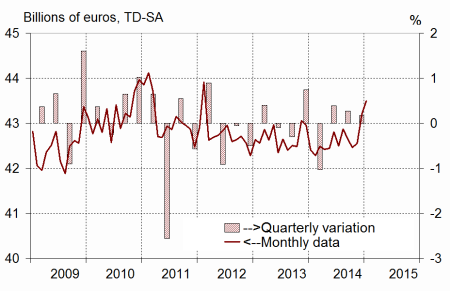
In January 2015, household consumption expenditure on goods continued to increase: +0.6% in volume*, after +1.6% in December. This rise resulted mainly from brisk purchases of cars and spending on gas and electricity. However, heating and fuel consumption declined markedly.
In January 2015, household consumption expenditure on goods continued to increase: +0.6% in volume*, after +1.6% in December. This rise resulted mainly from brisk purchases of cars and spending on gas and electricity. However, heating and fuel consumption declined markedly.
Engineered goods : growing in January
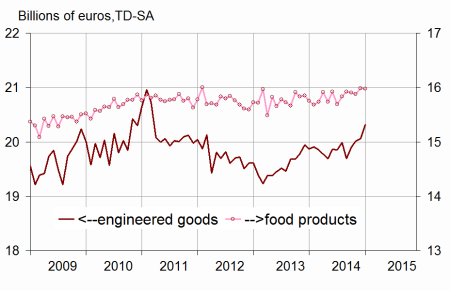
In January, household consumption of engineered goods grew sharply (+1.3% after +0.2%).
Durables: significant recovery
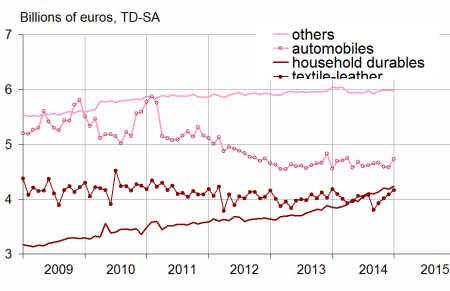
Household expenditure on durable goods picked up in January (+1.9% after –0.3%). This upturn was driven mainly by a sharp rise in car purchases (+3.2% after –0.1%). Expenditure on household durables, especially regarding furniture, bounced back as well (+1.4% after –0.5% in December).
Textile-leather: further increase
Consumption of textile, clothing and leather sped up in January (+2.0% after +1.7%). This was the fourth increase following the fall in September, during which consumption of clothing had reached its lowest level since October 2011.
Other engineered goods: slight drop
In January, consumption expenditure on other engineered goods dipped slightly (–0.2%, after +0.1%).
[* Volumes are chained and all figures are trading days and seasonally adjusted.]
graphiquegraph1_new_ang – Total consumption of goods
graphiquegraph2_new_ang – Food and engineered goods
graphiquegraph3_new_ang – Breakdown of engineered goods
Food products: almost stable
Consumption of food products was virtually flat in January (–0.1% after +0.7% in December). Consumption of tobacco declined slightly.
Energy: decelerating significantly
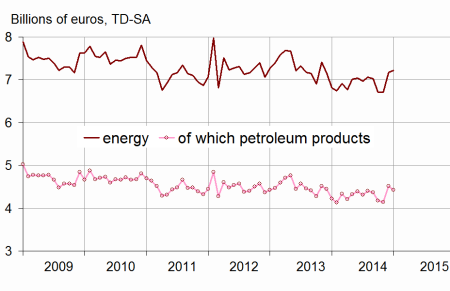
Household consumption of energy products slowed down markedly in January, after a surge in December (+0.6% after +6.9%). This turnaround essentially reflected the backlash in fuel and heating expenditure, which was very dynamic in December. Gas and electricity consumption continued to climb at a brisk pace with temperatures returning to a level close to seasonal norms, after a very mild fall.
The variation in December is scaled up by 0.1 point
The growth in household consumption of goods in December 2014 is scaled up by 0.1 point: it is now estimated at +1.6%, instead of +1.5% within the previous publication.
This revision is mainly due to the integration of new information, as well as the updating of the seasonal adjustment coefficients.
graphiquegraph4_new_ang – Energy
tableautab1_eng – Household consumption expenditure on goods
| Nov. | Dec. | Jan. | Jan.2015/ | |
|---|---|---|---|---|
| 2014 | 2014 | 2015 | Jan.2014 | |
| Food products | 15.882 | 15.988 | 15.974 | |
| Change (%) | –0.1 | 0.7 | –0.1 | 1.4 |
| Engineered goods | 20.013 | 20.057 | 20.313 | |
| Change (%) | 0.6 | 0.2 | 1.3 | 2.2 |
| Durables | 10.020 | 9.991 | 10.178 | |
| Change (%) | 0.1 | –0.3 | 1.9 | 5.6 |
| - of which automobiles | 4.591 | 4.584 | 4.731 | |
| Change (%) | –1.5 | –0.1 | 3.2 | 4.0 |
| - of which household durables | 4.203 | 4.180 | 4.237 | |
| Change (%) | 1.8 | –0.5 | 1.4 | 10.1 |
| Textile-leather | 4.016 | 4.083 | 4.163 | |
| Change (%) | 2.3 | 1.7 | 2.0 | –0.4 |
| Other engineered goods | 5.982 | 5.985 | 5.974 | |
| Change (%) | 0.3 | 0.1 | –0.2 | –1.2 |
| Energy | 6.708 | 7.173 | 7.214 | |
| Change (%) | 0.0 | 6.9 | 0.6 | 5.8 |
| - including petroleum products | 4.143 | 4.516 | 4.422 | |
| Change (%) | –0.7 | 9.0 | –2.1 | 4.7 |
| Total | 42.551 | 43.217 | 43.491 | |
| Change (%) | 0.2 | 1.6 | 0.6 | 2.6 |
| Manufactured goods | 36.651 | 37.124 | 37.196 | |
| Change (%) | 0.0 | 1.3 | 0.2 | 2.1 |
Documentation
Methodology (pdf,23 Ko)
Pour en savoir plus
