


 15 December 2014
2014- n° 285In Q3 2014, the labour cost index - wages and salaries remained stable and the labour
cost index - total labour cost increased by 0.1% Labor cost index in industry, construction and services - 3rd Quarter 2014
15 December 2014
2014- n° 285In Q3 2014, the labour cost index - wages and salaries remained stable and the labour
cost index - total labour cost increased by 0.1% Labor cost index in industry, construction and services - 3rd Quarter 2014
Warning: Since the Q1 2013, the tax credit for encouraging competitiveness and jobs (CICE) was included in the calculation of the labour cost index as a subsidy received by the employer. The rate of the CICE has increased from 4% to 6% from the 1st January of 2014. In Q3 2014, for business economy (excluding agriculture), the year-on-year changes of the labour cost index – total labour cost (+0.6%) is 0.9 points lower than what it would have been without CICE (+1.5%). The CICE has no impact on Q3 2014 quaterly variation nor on LCI – wages & salaries.
Warning: Since the Q1 2013, the tax credit for encouraging competitiveness and jobs (CICE) was included in the calculation of the labour cost index as a subsidy received by the employer. The rate of the CICE has increased from 4% to 6% from the 1 st January of 2014. In Q3 2014, for business economy (excluding agriculture), the year-on-year changes of the labour cost index – total labour cost (+0.6%) is 0.9 points lower than what it would have been without CICE (+1.5%). The CICE has no impact on Q3 2014 quaterly variation nor on LCI – wages & salaries.
The labour cost index - wages & salaries remained stable
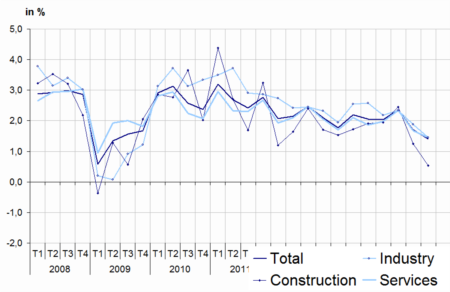
In the third quarter of 2014, the labour cost index (LCI) - wages & salaries for the business economy (excluding agriculture) slowed down (+0.0% after +0.3%) in seasonally adjusted data. In year-on-year changes, the LCI - wages & salaries increased by 1.4% after +1.7%. Work hours improved (+0.1% year-on-year).
graphiqueGraphSSangl – LCI - wages and salaries: year-on-year changes
- Sources: Acoss, Dares, Insee
Wages decreased by 0.2% in industrial activities
Wages decreased by 0.2% in industrial activities in Q3 2014 (after +0.7%). In electricity and gas, wages declined (-2.4% after +3.3%). Wages remained stable in manufacturing. Wages increased in mining and quarrying industry (+0.6% after -1.7%).
In year-on-year changes, wages in industrial activities slowed down slightly (+1.5% after +1.9%).
Wages slowed down in services but increased in construction
Wages stalled in services (+0.1% after +0.3% in the first second of 2014). Wages decreased in accommodation and food service, in information and communication and in real estate activities. In year-on-year changes, wages decelerated (1.4% after 1.7%). On the contrary, in construction, wages sped up slowly (+0.1% after –0.5%), but slowed down slightly in year-on-year changes (+0.5% after 1.2%).
tableautableauSSangl – LCI - wages & salaries
| Quarterly variations (%) | Annual variations (%) | |||
|---|---|---|---|---|
| Q2-14 | Q3-14 | Q2-14 | Q3-14 | |
| Industry | 0,7 | –0,2 | 1,9 | 1,5 |
| Mining and quarrying | –1,7 | 0,6 | 1,1 | 0,6 |
| Manufacturing | 0,5 | 0,0 | 2,0 | 1,4 |
| Electricity, gas, steam and air conditioning supply | 3,3 | –2,4 | 1,2 | 1,6 |
| Water supply; sewerage, waste management and remediation activities | 0,0 | 0,7 | 0,3 | 0,9 |
| Services | 0,3 | 0,1 | 1,7 | 1,4 |
| Wholesale and retail trade; repair of motor vehicles and motorcycles | 0,6 | 0,0 | 1,8 | 1,5 |
| Transportation and storage | 0,4 | 0,1 | 1,4 | 1,2 |
| Accommodation and food service activities | 0,7 | –0,5 | 2,5 | 1,2 |
| Information and communication | 0,6 | –0,1 | 2,2 | 1,1 |
| Financial and insurance activities | –0,5 | 0,6 | 1,7 | 2,0 |
| Real estate activities | 0,8 | –0,9 | 2,8 | 1,8 |
| Professional, scientific and technical activities | 0,1 | 0,2 | 1,7 | 1,6 |
| Administrative and support service activities | –0,3 | 0,2 | 0,7 | 1,1 |
| Construction | –0,5 | 0,1 | 1,2 | 0,5 |
| TOTAL | 0,3 | 0,0 | 1,7 | 1,4 |
- Sources: Acoss, Dares, Insee
- Field: non-agricultural market sector excluding household services
The evolution of wages and salaries during the second quarter of 2014 is revised by +0.1 point in quarter-to-quarter changes.
The labour cost index - total labour cost increased by 0.1%
In the third quarter of 2014, the labour cost index (LCI) - total labour cost for the business economy increased by 0.1% in seasonnally adjusted data, after a rise by 0.3% in the second quarter.
In year-on-year changes, the LCI - total labour cost has slowed down in the third quarter (+0.6% after +1.0%). Without the tax credit for encouraging competitiveness and jobs (CICE), the LCI - total labour cost would have also slowed down (+1.5% after +1.9% in year-on-year changes).
graphiqueGraphSCangl – LCI - total labour cost: year-on-year changes
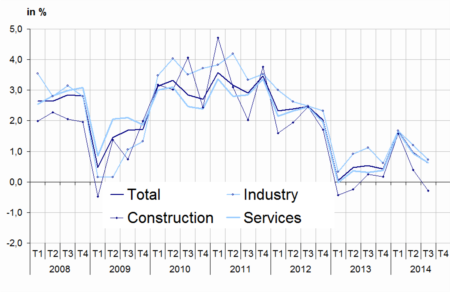
- Sources: Acoss, Dares, Insee
No revision of Q1 2014 LCI – total labour cost
The change of labour cost index (LCI) – total labour cost in the second quarter of 2014 is not revised neither in quarterly variations nor in year-on-year changes.
tableautableauSCangl – LCI - total labour cost
| Quarterly variations (%) | Annual variations (%) | |||
|---|---|---|---|---|
| Q2-14 | Q3-14 | Q2-14 | Q3-14 | |
| Industry | 0,7 | –0,1 | 1,2 | 0,7 |
| Mining and quarrying | –1,7 | 0,6 | 0,4 | –0,2 |
| Manufacturing | 0,5 | 0,0 | 1,3 | 0,7 |
| Electricity, gas, steam and air conditioning supply | 3,3 | –2,4 | 0,8 | 1,1 |
| Water supply; sewerage, waste management and remediation activities | 0,0 | 0,8 | –0,6 | 0,1 |
| Services | 0,3 | 0,1 | 0,9 | 0,6 |
| Wholesale and retail trade; repair of motor vehicles and motorcycles | 0,6 | 0,1 | 1,0 | 0,6 |
| Transportation and storage | 0,5 | 0,2 | 0,4 | 0,2 |
| Accommodation and food service activities | 0,8 | –0,5 | 1,2 | –0,4 |
| Information and communication | 0,6 | –0,1 | 1,8 | 0,6 |
| Financial and insurance activities | –0,5 | 0,6 | 1,3 | 1,6 |
| Real estate activities | 0,9 | –0,9 | 2,1 | 1,1 |
| Professional, scientific and technical activities | 0,1 | 0,2 | 1,3 | 1,1 |
| Administrative and support service activities | –0,3 | 0,2 | –0,5 | 0,0 |
| Construction | –0,4 | 0,3 | 0,4 | –0,3 |
| TOTAL | 0,3 | 0,1 | 1,0 | 0,6 |
- Sources: Acoss, Dares, Insee
- Field: non-agricultural market sector excluding household services
tableau – LCI - total labour cost (without CICE)
| Quarterly variations (%) | Annual variations (%) | |||
|---|---|---|---|---|
| Q2-14 | Q3-14 | Q2-14 | Q3-14 | |
| Industry | 0,7 | -0,1 | 2,1 | 1,6 |
| Mining and quarrying | -1,7 | 0,6 | 1,4 | 0,8 |
| Manufacturing | 0,5 | 0,0 | 2,2 | 1,6 |
| Electricity, gas, steam and air conditioning supply | 3,3 | -2,4 | 1,4 | 1,7 |
| Water supply; sewerage, waste management and remediation activities | 0,0 | 0,8 | 0,4 | 1,1 |
| Services | 0,3 | 0,1 | 1,8 | 1,5 |
| Wholesale and retail trade; repair of motor vehicles and motorcycles | 0,6 | 0,1 | 2,1 | 1,7 |
| Transportation and storage | 0,5 | 0,2 | 1,5 | 1,2 |
| Accommodation and food service activities | 0,8 | -0,5 | 2,6 | 1,0 |
| Information and communication | 0,6 | -0,1 | 2,3 | 1,2 |
| Financial and insurance activities | -0,5 | 0,6 | 1,8 | 2,1 |
| Real estate activities | 0,9 | -0,9 | 3,0 | 2,0 |
| Professional, scientific and technical activities | 0,1 | 0,2 | 1,9 | 1,7 |
| Administrative and support service activities | -0,3 | 0,2 | 0,8 | 1,2 |
| Construction | -0,4 | 0,3 | 1,5 | 0,8 |
| TOTAL | 0,3 | 0,1 | 1,9 | 1,5 |
- Field: non-agricultural market sector excluding household services
Pour en savoir plus
