


 30 September 2014
2014- n° 227Overall producer prices of agricultural products decreased in August Indices of agricultural prices - August 2014
30 September 2014
2014- n° 227Overall producer prices of agricultural products decreased in August Indices of agricultural prices - August 2014
In August, overall agricultural producer prices dropped by 1.6 % compared to July; over one year they fell by 4.4 %.
In August, overall agricultural producer prices dropped by 1.6 % compared to July; over one year they fell by 4.4 %.
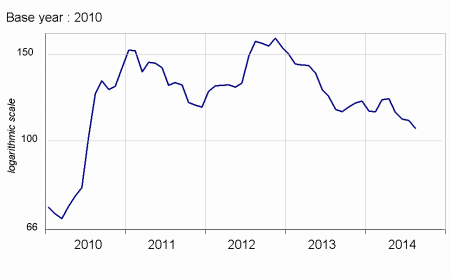
Due to abundant global availabilities, cereal prices kept on decreasing in August, showing a drop of 7.1 % over three months. The huge crops of wheat and maïze, in Europe and in the United States, added up to the already high stocks.
graphiquecereal – Producer prices of cereals
Also as a result of a global sustained production, oleaginous prices continued to decrease in August (–13.3 % over the quarter).
Overall prices of wines increased by 11.3 % over one year (and by 16.8 % for PDO wines), further to the drop in crops for the last two years.
Potato prices tumbled by half compared to last year. This was a return to normal as the last but one crop, in 2012, had been particularly weak in North-Western Europe.
Fresh fruit prices dropped year-over-year (–22.1 %). Apricots and peaches abounded as their productions recovered this year, while their consumptions were moderate in relation to the dull weather this summer. The summer-pear sold sluggishly : the supply this year was too early to fully meet the demand, while the Russian embargo limited the outlets (Russia is one of the main outlet for the French summer-pear).
graphiquevegetable – Producer prices of vegetables
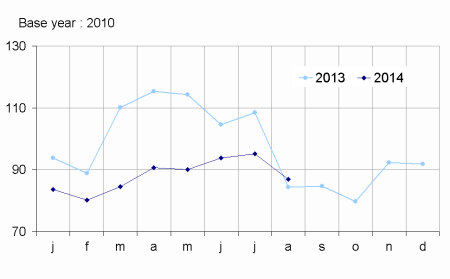
- Source : SSP (Ministry of Agriculture)
Prices for fresh vegetables rose slightly (+3.1 %) in August. Melon prices surged because of reduced yields due to the dull weather. However, it seemed that the dull weather did not dampen its consumption. Conversely, it penalised the demand for other fresh summer-vegetables which are eaten raw, such as tomatoes or cucumbers ; and encouraged the shift to the courgette, which is eaten cooked.
graphiquepig – Producer prices of pigs and large cattle
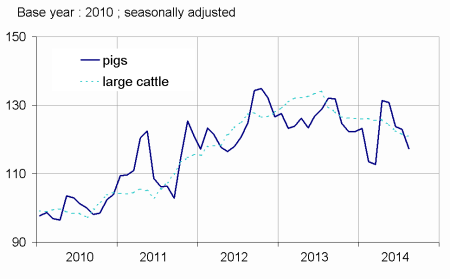
On a seasonally adjusted basis, animal prices still decreased in August (–4.4 % over one quarter). The drop in pig prices was significant in August (-4.6 %) : the supply faced the North-European competition while the Russian embargo limited the outlets. Beef consumption was sluggish; this was reflected by a significant fall in cattle prices over one year (-6.3 %).
tableauTab1 – Indices of producer prices of agricultural products (IPPAP)
| Variation as % over | |||||
|---|---|---|---|---|---|
| weights | Aug. 2014 | a month | 3 months | a year | |
| raw | Seasonally adjusted | raw | |||
| Agricultural goods output | 1000 | 114.7 | –1.6 | –3.8 | –4.4 |
| excluding fruits and vegetables | 900 | 117.3 | –1.5 | –3.8 | –4.1 |
| Crop output (excluding fruits and vegetables) | 503 | 114.4 | –1.8 | –5.0 | –5.4 |
| Cereals | 188 | 106.0 | –3.6 | –7.1 | –8.5 |
| of which soft wheat | 112 | 104.1 | –4.3 | –9.5 | –6.5 |
| grain maize | 41 | 93.0 | –4.3 | –9.2 | –21.0 |
| Potatoes | 26 | 117.3 | /// | /// | –50.2 |
| Wines | 177 | 130.5 | –1.5 | –2.4 | +11.3 |
| Protected designation of origin | 84 | 141.4 | –1.4 | –3.9 | +16.8 |
| other wines | 23 | 129.8 | –4.9 | –1.4 | +8.7 |
| Oleaginous | 49 | 86.2 | –2.0 | –13.3 | –10.8 |
| Horticultural products | 30 | 107.1 | +0.2 | +1.9 | +2.0 |
| Other crop products | 33 | 122.8 | –0.9 | –2.1 | –6.2 |
| Fruits and vegetables (1) | 100 | 90.6 | /// | /// | –7.9 |
| Fresh vegetables | 53 | 86.9 | /// | /// | +3.1 |
| Fresh fruits | 35 | 90.1 | /// | /// | –22.1 |
| Animal output | 397 | 121.0 | –1.2 | –2.3 | –2.5 |
| Animals | 235 | 118.9 | –1.6 | –4.4 | –6.6 |
| of which large cattle | 96 | 122.7 | –0.6 | –2.7 | –6.3 |
| calves | 26 | 105.7 | +0.1 | –5.2 | +0.8 |
| pigs | 54 | 123.2 | –4.6 | –10.4 | –11.2 |
| sheep | 10 | 115.6 | –3.6 | –5.5 | –4.0 |
| poultry | 46 | 115.1 | –0.4 | –0.1 | –5.8 |
| of which chicken | 28 | 115.4 | –0.4 | +0.1 | –5.9 |
| Milk | 147 | 125.7 | 0.0 | +0.8 | +3.0 |
| of which cow milk (2) | 137 | 127.2 | 0.0 | +0.8 | +3.2 |
| Eggs | 15 | 107.6 | –7.5 | +3.0 | +14.9 |
- (1) Including vegetables for industry.
- (2) The price for August is not yet known and therefore is estimated by carrying forward the seasonally adjusted price from July
- Sources: Insee - SSP (ministry of agriculture)
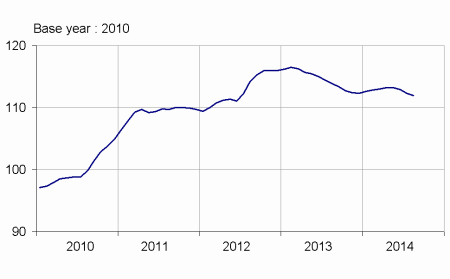
Overall purchase prices of the means of agricultural production went down in August.
Intermediate consumptions prices slipped by 0.5 % this month. Over one year, feed prices dropped by 6.6 %. Prices of investment goods increased slightly in August (+0.2 %).
graphiquemeans – Purchase price of the means of agricultural production
tableauTab2 – Indices of purchase prices of the means of agricultural production (IPAMPA)
| weights | Aug. 2014 | Variation as % over | |||
|---|---|---|---|---|---|
| a month | 3 months | a year | |||
| Total input | 1000 | 112.0 | –0.3 | –1.1 | –1.7 |
| Intermediate consumptions | 764 | 113.8 | –0.5 | –1.4 | –2.4 |
| Energy | 100 | 116.4 | –1.0 | –0.3 | –3.6 |
| Seeds | 57 | 108.7 | +0.1 | –0.3 | +0.5 |
| Fertilisers and soil improvers | 92 | 115.1 | +0.1 | –3.8 | –3.3 |
| Plant protection products | 78 | 101.3 | +0.1 | 0.0 | +0.3 |
| Animal feed | 205 | 122.2 | –1.4 | –3.2 | –6.6 |
| Veterinary expenses | 43 | 112.1 | +0.6 | +0.9 | +2.6 |
| Small equipment and tools | 17 | 109.5 | +0.4 | +1.3 | –0.4 |
| Maintenance of materials | 67 | 111.5 | –0.1 | +0.3 | +2.5 |
| Maintenance of buildings | 9 | 106.7 | 0.0 | 0.0 | +0.1 |
| Other goods and services | 97 | 102.5 | 0.0 | +0.1 | +1.0 |
| Goods and services contributing to investment | 236 | 106.6 | +0.2 | –0.1 | +1.0 |
| Material | 186 | 106.8 | +0.4 | +0.2 | +1.4 |
| Tractors | 79 | 106.5 | +0.9 | –0.1 | +1.4 |
| Machinery and plant for cultivation | 36 | 108.3 | –0.1 | +0.7 | +2.3 |
| Machinery and plant for harvesting | 42 | 106.8 | –0.1 | –0.2 | +0.5 |
| Utility vehicles | 18 | 105.4 | +0.4 | +0.9 | +2.3 |
| Buildings | 50 | 106.0 | –0.3 | –1.0 | –0.7 |
- (1) The repayment of the domestic tax on energy products (TICPE) benefiting farmers has been applied in advance for the year 2014
- Sources: Insee - SSP (ministry of agriculture)
Documentation
Methodology (pdf,122 Ko)
Pour en savoir plus
Time series : Indices of agricultural prices
