


 20 October 2015
2015- n° 254Rebound in business start-ups in September 2015 Enterprise births - September 2015
20 October 2015
2015- n° 254Rebound in business start-ups in September 2015 Enterprise births - September 2015
In September 2015, the number of business births rebounded (+3.6% for all entreprises, seasonally and working-day adjusted). Excluding self managed micro-entrepreneurs, business start-ups picked up (+3.8% following –1.6%), getting back to their trend of the last months (an average of +1.6% per month since October 2014). Self-managed micro-entrepreneurs' registrations kept recovering (+3.2% following +0.7%).
In September 2015, the number of business births rebounded (+3.6% for all entreprises, seasonally and working-day adjusted). Excluding self managed micro-entrepreneurs, business start-ups picked up (+3.8% following –1.6%), getting back to their trend of the last months (an average of +1.6% per month since October 2014). Self-managed micro-entrepreneurs' registrations kept recovering (+3.2% following +0.7%).
–4.3% year-on-year (quarterly basis)
The raw amount of births added up in the last three months came down by 4.3% compared to the same months one year before, for all entreprises, because of the drop of self-managed micro-entrepreneurs' registrations (–23,5 %). Trade and construction were the sectors that most contributed to this dip1.
–3.0% year-on-year (twelve months basis)
The raw number of business start-ups totted up during the last twelve months decreased by 3.0% year-on-year. This was due to the fall in self-managed micro-entrepreneurs' set-ups (–14.5%), while other enterprises' start-ups kept rising, including companies (+3.4%).
A little less than half of the new entrepreneurs is a self-managed micro-entrepreneur
In September 2015, 45.2% of business set-ups over the last twelve months were micro–entrepreneurs' registrations.
tableautab0EN – Business set-ups distribution by type
| July 2015 | Aug. 2015 | Sept. 2015 | |
|---|---|---|---|
| Companies | 31,5 | 31,7 | 32,0 |
| Sole proprietorships excluding self-managed micro-entrepreneurs | 21,8 | 22,2 | 22,9 |
| Self-managed micro-entrepreneurs | 46,7 | 46,1 | 45,2 |
- Source: INSEE (Sirene)

1 The contribution of a sector to the overall variation is the observed variation of this sector, weighted by the share of this sector in the total number of births.
graphiqueGraph1EN – Business start-ups (sa-wda *)
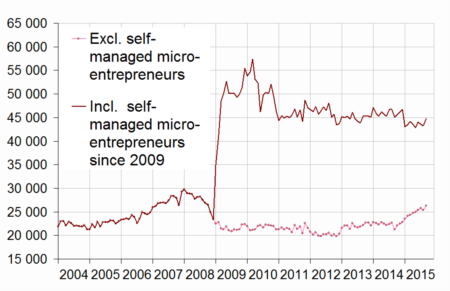
- * Seasonally and working-day adjusted data
- Source: INSEE (Sirene)
graphiqueGraph2EN – Trade and business support activities start-ups (sa-wda *)

- * Seasonally and working-day adjusted data
- Source: INSEE (Sirene)
graphiqueGraph3EN – Construction and real estate business start-ups (sa-wda *)
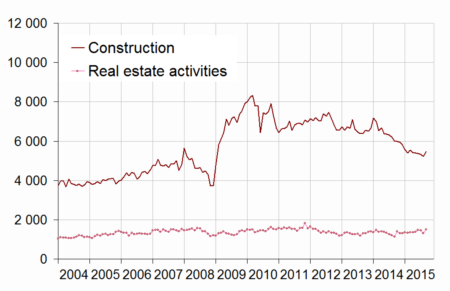
- * Seasonally and working-day adjusted data
- Source: INSEE (Sirene)
tableautab1EN – Business set-ups by month (sa-wda *)
| June 2015 | July 2015 | Aug. 2015 | Sept. 2015 | |
|---|---|---|---|---|
| Excl. self-managed micro-entrepreneurs | 25,406 | 25,747 | 25,340 | 26,312 |
| Variation [m-o-m] % | 1.8 | 1.3 | -1.6 | 3.8 |
| Incl. self-managed micro-entrepreneurs | 44,057 | 43,554 | 43,265 | 44,816 |
| Variation [m-o-m] % | 2.9 | -1.1 | -0.7 | 3.6 |
- * Seasonally and working-day adjusted data
- Source: INSEE (Sirene)
tableautab2EN – Business start-ups by type
| Moving total % change * | Moving total | Moving total | ||
|---|---|---|---|---|
| over 3 months | over 12 months | January- September 2015 | January- September 2014 | |
| Total | -4.3 | -3.0 | 392,672 | 412,395 |
| Companies | 6.7 | 3.4 | 126,692 | 122,749 |
| Sole proprietorships | -8.9 | -5.8 | 265,980 | 289,646 |
| Of which self-managed micro-entrepreneurs | -23.5 | -14.5 | 168,390 | 212,058 |
- * Total of business start-ups during the last 3 or 12 months compared with the same months a year earlier
- Source: INSEE (Sirene)
tableautab3EN – Number of business set-ups (incl. self-managed micro-enterprises)
| NA | July 2015 | Aug. 2015 | Sept. 2015 | |
|---|---|---|---|---|
| Total | 43,554 | 43,265 | 44,816 | |
| Industry | BE | 1,986 | 2,043 | 2,031 |
| Of which Manufacturing | C | 1,763 | 1,772 | 1,805 |
| Construction | FZ | 5,328 | 5,234 | 5,474 |
| Wholesale and retail trade, Transport, Accommodation and Food and beverage activities | GI | 11,989 | 12,228 | 12,812 |
| Of which Trade | G | 7,968 | 8,121 | 8,325 |
| Of which Transportation and storage | H | 1,567 | 1,387 | 2,128 |
| Of which Accommodation and food service activities | I | 2,382 | 2,394 | 2,440 |
| Information and communication | JZ | 2,069 | 2,086 | 2,106 |
| Financial and insurance activities | KZ | 1,325 | 1,157 | 1,335 |
| Real estate activities | LZ | 1,443 | 1,309 | 1,502 |
| Business support activities | MN | 9,665 | 9,453 | 9,704 |
| Public administration and defence, education, human health and social work activities | OQ | 5,764 | 5,627 | 5,510 |
| Other services activities | RS | 3,986 | 4,128 | 4,342 |
- * Seasonally and working-day adjusted data
- Source: INSEE (Sirene)
tableautab3bisEN – Fluctuation in the number of business set-ups (incl. self-managed micro-entrepreneurs)
| NA | Sept. 15 / Aug. 15 | Moving total % change** | ||
|---|---|---|---|---|
| sa-wda * | over 3 months | over 12 months | ||
| Total | 3.6 | -4.3 | -3.0 | |
| Industry | BE | -0.6 | -15.4 | -11.3 |
| Of which Manufacturing | C | 1.9 | -18.2 | -12.3 |
| Construction | FZ | 4.6 | -13.1 | -14.7 |
| Wholesale and retail trade, Transport, Accommodation and Food and beverage activities | GI | 4.8 | -3.2 | -1.0 |
| Of which Trade | G | 2.5 | -9.9 | -7.1 |
| Of which Transportation and storage | H | 53.4 | 52.1 | 50.0 |
| Of which Accommodation and food service activities | I | 1.9 | -6.3 | -0.6 |
| Information and communication | JZ | 1.0 | -6.5 | -0.7 |
| Financial and insurance activities | KZ | 15.4 | 5.8 | 11.5 |
| Real estate activities | LZ | 14.7 | 19.8 | 3.1 |
| Business support activities | MN | 2.7 | -3.2 | -1.3 |
| Public administration and defence, education, human health and social work activities | OQ | -2.1 | 1.0 | 4.4 |
| Other services activities | RS | 5.2 | -8.8 | -6.3 |
- * Seasonally and working-day adjusted data
- ** Total of business start-ups during the last 3 or 12 months compared with the same months a year earlier
- Source: INSEE (Sirene)
Pour en savoir plus
Time series : Business demography
