


 23 January 2015
2015- n° 16In January 2015, the business climate is stable in services Monthly survey of services - January 2015
23 January 2015
2015- n° 16In January 2015, the business climate is stable in services Monthly survey of services - January 2015
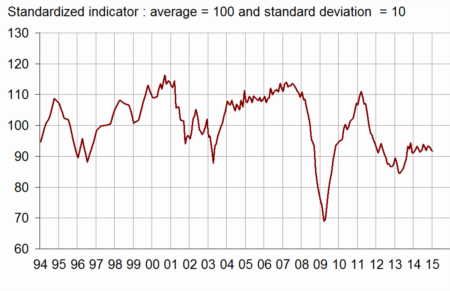
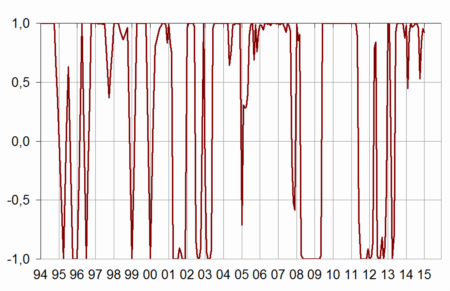
According to business managers, the economic situation in services is stable in January 2015. The business climate composite indicator is unchanged (92) and remains far below its long-term average. The turning point indicator indicates a favorable dynamic.
All services
According to business managers, the economic situation in services is stable in January 2015. The business climate composite indicator is unchanged (92) and remains far below its long-term average. The turning point indicator indicates a favorable dynamic.
The balance on the general outlook, which relates the assessment of business leaders over their whole sector, decreases by two points and deviates further from its long-term average.
More business managers report that their activity has deteriorated over the last few months. Their business prospects on activity and demand for the coming months are roughly stable since December. The corresponding balances remain far below their long-term average.
The balance of opinion on the past operating balance result has fallen since October and stands below its long-term average. The balance on the expected result is stable.
In service sectors except temporary employment agencies, the balances of opinion on past and expected employment have declined and deviate a little further from their long-term average.
graphiqueGraph1 – Composite indicator
graphiquegraph_retourn – Turning point indicator
tableauTable_quarter – Economic outlook in the services sector
| Average* | Oct. 14 | Nov. 14 | Dec. 14 | Jan. 15 | |
|---|---|---|---|---|---|
| Composite indicator | 100 | 93 | 93 | 92 | 92 |
| General outlook | –8 | –19 | –17 | –16 | –18 |
| Past activity | 2 | –5 | –3 | –4 | –9 |
| Expected activity | 2 | –6 | –4 | –8 | –7 |
| Expected demand | –1 | –7 | –9 | –9 | –8 |
| Business situation | –3 | –8 | –6 | –8 | –11 |
| Past selling prices | –4 | –9 | –8 | –11 | –10 |
| Expected selling prices | –2 | –10 | –10 | –12 | –13 |
| Past employment | 3 | 4 | –2 | –2 | –4 |
| except temporary work agencies | 1 | 0 | 0 | –1 | –3 |
| Expected employment | 2 | 0 | –1 | 0 | –5 |
| except temporary work agencies | –1 | –5 | –5 | –3 | –6 |
| Investments | |||||
| Past investments | 1 | –1 | –1 | –5 | –4 |
| Expected investments | 1 | –1 | –2 | 1 | 0 |
| Operating balance result | |||||
| Past result | –2 | 1 | –11 | ||
| Expected result | –2 | –9 | –9 | ||
| Cash position | –11 | –15 | –15 | ||
| Difficulties of supply and demand | |||||
| difficulties of supply and demand | 10 | 13 | 13 | ||
| difficulties of supply only | 22 | 18 | 18 | ||
| difficulties of demand only | 32 | 39 | 41 | ||
| Difficulties in recruitment | 28 | 17 | 18 |
- * Average of the balances of opinion since 1988
- Source: INSEE
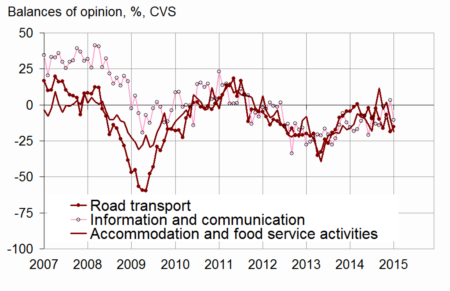
Road transport
In road freight and mail activities, less business managers than in December indicate a decrease in past activity. However, the corresponding balance remains below its long-term average. The balances on expected activity, demand and employment have deteriorated sharply.
Accommodation and food service activities
In accommodation and food service activities, more business managers consider that their activity has declined over the last few months and expect it to decrease during the coming months. The balances of opinion on past and expected employment have also gone down.
Information and communication
In information and communication, the balance of opinion on past activity has fallen and departs significantly from its long-term level. However, the expectations on activity and demand have recovered, although they stay below their long-term average.
Real estate
In real estate activities, the balances of opinion on expected activity and demand have decreased. Nevertheless, the balance on expected employment has recovered markedly and comes back above its long-term average.
Professional, scientific and technical activities
In professional, scientific and technical activities, the balances on past and expected activity are stable. Business managers’ expectations on demand are less pessimistic than in December but stay below their long-term trend.
Administrative and support service activities
In administrative and support service activities, the balance of opinion on past activity remains deteriorated. Business leaders’ expectations on activity, demand and employment have decreased significantly.
graphiquegraph_bonus_ – Past activity
tableauTable_det – Detailed data
| NA*: A21 | Average* | Oct. 14 | Nov. 14 | Dec. 14 | Jan. 15 |
|---|---|---|---|---|---|
| (H) Road transport | |||||
| Past activity | –8 | –16 | –7 | –18 | –15 |
| Expected activity | –10 | –10 | –8 | –10 | –20 |
| Expected demand | –13 | –10 | –9 | –17 | –22 |
| Past employment | –8 | –16 | –8 | –4 | –6 |
| Expected employment | –11 | –9 | –10 | –4 | –18 |
| (I) Accommodation and food service activities | |||||
| Past activity | –7 | –3 | 2 | –10 | –19 |
| Expected activity | –7 | –10 | –9 | –5 | –11 |
| Expected demand | –9 | –11 | –10 | –11 | –12 |
| Past employment | –4 | 7 | –5 | –2 | –7 |
| Expected employment | –5 | –13 | –19 | –9 | –14 |
| (J) Information and communication | |||||
| Past activity | 9 | –1 | –9 | 3 | –10 |
| Expected activity | 10 | –8 | –10 | –18 | –7 |
| Expected demand | 11 | –5 | –8 | –10 | 3 |
| Past employment | 6 | –9 | –4 | 0 | 3 |
| Expected employment | 11 | 3 | 5 | 1 | –4 |
| (L) Real estate activities | |||||
| Past activity | 7 | –2 | 7 | 8 | 7 |
| Expected activity | 7 | 5 | 4 | 3 | 1 |
| Expected demand | 1 | –5 | –4 | –1 | –5 |
| Past employment | 3 | 8 | –4 | 0 | –3 |
| Expected employment | 2 | 5 | 1 | –3 | 7 |
| (M) Professional, scientific and technical activities | |||||
| Past activity | –1 | –8 | –7 | –8 | –7 |
| Expected activity | –2 | –7 | –8 | –12 | –12 |
| Expected demand | –6 | –9 | –14 | –15 | –12 |
| Past employment | 1 | 0 | 1 | 2 | 0 |
| Expected employment | 0 | –3 | –7 | –4 | –1 |
| (N) Administrative and support service activities | |||||
| Past activity | 6 | –4 | –3 | –11 | –11 |
| Expected activity | 5 | –1 | –1 | 3 | –5 |
| Expected demand | 3 | –3 | –4 | 1 | –8 |
| Past employment | 8 | 12 | 1 | –2 | –5 |
| Expected employment | 6 | 6 | 11 | 7 | –5 |
- * Aggregated classification - NA 2008
- ** Average of the balances of opinion since 1988 (2006 for road transport)
Documentation
Methodology (2016) (pdf,158 Ko)
Pour en savoir plus
Time series : Economic outlook surveys – Services
