


 12 December 2014
2014- n° 284Increase in business start-ups in November 2014 Enterprise births - November 2014
12 December 2014
2014- n° 284Increase in business start-ups in November 2014 Enterprise births - November 2014
In November 2014, the number of business start-ups including self-managed enterprises seasonally and working-day adjusted (sa-wda) increased compared to October (+1.0%) for all business start-ups. The rise was stronger (+1.5%) excluding self-managed enterprises (auto–entreprises).
In November 2014, the number of business start-ups including self-managed enterprises seasonally and working-day adjusted (sa-wda) increased compared to October (+1.0%) for all business start-ups. The rise was stronger (+1.5%) excluding self-managed enterprises (auto–entreprises).
+1.9% year-on-year (quarterly basis)
The amount of births added up in the last three months went up compared to the same months one year before (+1.9%) for all entreprises. This increase was driven by companies (+4.2%) and self-managed enterprises (+5.1%).
The sectors that most contributed to that growth were “trade, transportation and storage, accommodation and food service activities” and “business support activities”.
+2.4% year-on-year (twelve months basis)
During the last twelve months, the number of business start-ups rose by 2.4% year-on-year, especially for companies (+4.6%).
More than half of business set-ups are self–managed enterprises
In November 2014, 51.5% of business set-ups over the last twelve months were self-managed enterprises.
tableautab0EN – Business set-ups distribution by type %
| Sept. 2014 | Oct. 2014 | Nov. 2014 | |
|---|---|---|---|
| Companies | 30.0 | 30.0 | 30.1 |
| Sole proprietorships excluding self-managed enterprises | 18.8 | 18.6 | 18.4 |
| Self-managed business | 51.2 | 51.4 | 51.5 |
- Source: INSEE (Sirene)
tableautab1EN – Business set-ups by month (sa-wda *)
| Aug. 2014 | Sept. 2014 | Oct. 2014 | Nov. 2014 | |
|---|---|---|---|---|
| Excl. self-managed enterprises | 22,448 | 21,582 | 22,058 | 22,393 |
| Variation [m-o-m] % | -0.6 | -3.9 | 2.2 | 1.5 |
| Incl., self-managed enterprises | 46,266 | 45,627 | 45,868 | 46,338 |
| Variation [m-o-m] % | -0.9 | -1.4 | 0.5 | 1.0 |
- * Seasonally and working-day adjusted data
- Source: INSEE (Sirene)
tableautab2EN – Business start-ups by type
| Moving total % change* | Moving total | Moving total | ||
|---|---|---|---|---|
| over 3 months | over 12 months | January- November 2014 | January- November 2013 | |
| Total | 1.9 | 2.4 | 506,747 | 497,494 |
| Companies | 4.2 | 4.6 | 150,448 | 144,618 |
| Sole proprietorships | 1.1 | 1.5 | 356,299 | 352,876 |
| Of which self-managed | 5.1 | 2.9 | 263,145 | 256,340 |
- * Total of business start-ups during the last 3 or 12 months compared with the same months a year earlier
- Source: INSEE (Sirene)
graphiqueGraph1EN – Business start-ups (sa-wda *)
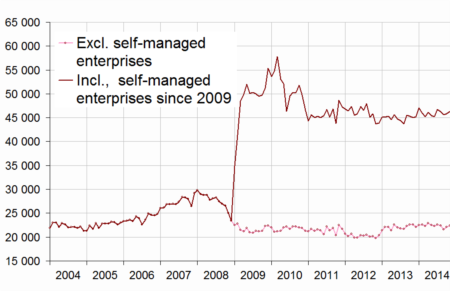
- * Seasonally and working-day adjusted data
- Source: INSEE (Sirene)
Pour en savoir plus
Time series : Business demography
