


 30 November 2015
2015- n° 297In October 2015, overall agricultural producer prices rose by 0.5% Indices of agricultural prices - October 2015
30 November 2015
2015- n° 297In October 2015, overall agricultural producer prices rose by 0.5% Indices of agricultural prices - October 2015
In October 2015, overall agricultural producer prices rose by 0.5% compared to the previous month, and by 1.3% over one year.
In October 2015, overall agricultural producer prices rose by 0.5% compared to the previous month, and by 1.3% over one year.
Rally in cereal and oleaginous prices
Cereal prices recovered in October (+5.4%, after –14.7% between July and September), despite an abundant supply confirmed by the new crop in the Northern hemisphere. The market reacted noticeably to the potential consequences that would arise from the drough in Australia and from the floods in the United-States.
graphiquecereal – Producer prices of cereals
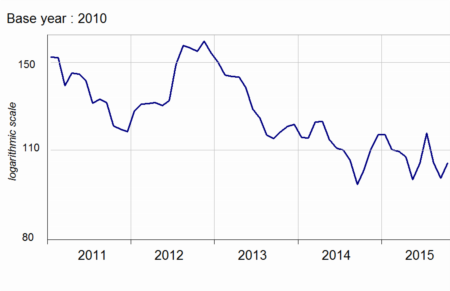
- Source: INSEE
Oleaginous prices picked up by 3.4 % in October due to the drop in production of rape, the main oleaginous grain produced in France. Moreover, the palm oil price increase was transmitted to rape, these two products being partially sustituable.
Rebound in the prices of potatoes
Compared to October 2014, potatoe prices increased by more than 60 % yoy. The 2015 crop reached its long-term average whereas the previous one was exceptional. Conversely, industrial bett price fell by almost 20 % yoy, dragged down by the drop in producer price of sugar in France.
Rise in the prices of fresh fruits and vegetables compared to October 2014
Fresh fruits prices increased sharply over 12 months (+18.4%), and noticeably apple price (+27.0%). The low apple prices last year reflected the congestion in the supply in relation with an abundant European crop and the Russian embargo since August 2014. Pears prices went up as well over one year due to a decline in European supply.
graphiquevegetable – Producer prices of fresh vegetables
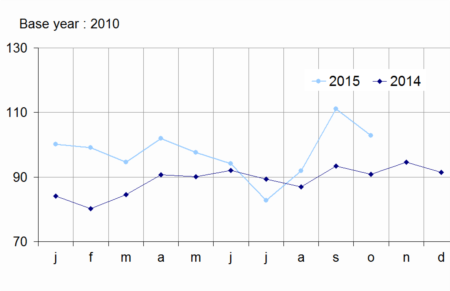
- Source: SSP (ministry in charge of agriculture)
Fresh vegetables prices increased by more than 13% yoy. The increases in prices of chicory (+22%), lettuce (+45%) and leek (+14%) would come from less significant harvests. Consumers kept turning to tomatoes whose price rose also (+7%).
Near stability in animal prices, sharp decline in egg and milk prices
On a seasonally adjusted basis, prices of animals were almost stable this month (+0.1%), as the rise in calve and poultry prices offset the falls in pig and large cattle prices.
graphiquepig – Producer prices of pigs and large cattle
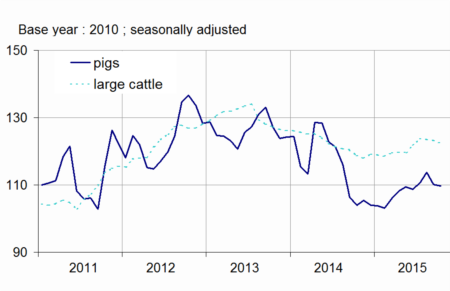
Egg prices slid by 8.8 % after surging the previous month in relation with the slump in American supply affected by an avian flue episode. Milk price plummeted by 16% over one year reflecting the global overproduction combined with the slowndown of the Chinese demand.
tableauTab1 – Indices of producer prices of agricultural products (IPPAP)
| Weights | Oct. 2015 | Variation as % over | |||
|---|---|---|---|---|---|
| a month | 3 months | a year | |||
| raw | Seasonally adjusted | raw | |||
| Agricultural goods output | 1000 | 112.3 | +0.5 | –0.1 | +1.3 |
| excluding fruits and vegetables | 900 | 112.4 | +0.6 | –1.9 | +0.2 |
| Crop output (excluding fruits and vegetables) | 505 | 114.8 | +1.3 | –2.9 | +4.0 |
| Cereals | 188 | 104.9 | +5.4 | –10.1 | +2.2 |
| of which soft wheat | 112 | 100.7 | +8.6 | –10.1 | +2.5 |
| grain maize | 41 | 97.0 | +2.5 | –8.1 | +15.1 |
| Potatoes | 26 | 147.3 | /// | /// | +62.4 |
| Wines | 177 | 129.6 | +0.6 | +0.5 | –0.1 |
| Protected designation of origin | 84 | 134.3 | +0.9 | +0.9 | –1.2 |
| other wines | 23 | 149.4 | +0.9 | +0.2 | +3.4 |
| Oleaginous | 49 | 102.8 | +3.4 | –1.6 | +19.0 |
| Horticultural products | 30 | 110.8 | +3.2 | +3.8 | +4.5 |
| Other crop products | 36 | 90.4 | –15.3 | –16.4 | –14.9 |
| Fruits and vegetables (1) | 100 | 111.1 | /// | /// | +13.1 |
| Fresh vegetables | 53 | 102.9 | /// | /// | +13.3 |
| Fresh fruits | 35 | 122.9 | /// | /// | +18.4 |
| Animal output | 395 | 109.3 | –0.3 | –0.5 | –4.5 |
| Animals | 234 | 114.8 | +0.1 | +0.1 | +2.2 |
| of which large cattle | 96 | 121.0 | –0.7 | –1.1 | +3.3 |
| calves | 26 | 105.3 | +4.4 | +4.4 | –2.3 |
| pigs | 54 | 110.2 | –0.4 | –0.9 | +5.5 |
| sheep | 10 | 119.4 | +0.2 | +4.3 | +0.8 |
| poultry | 46 | 111.9 | +0.6 | +1.7 | –0.6 |
| of which chicken | 28 | 112.1 | +0.4 | +2.0 | –0.5 |
| Milk | 147 | 99.4 | 0.0 | –0.7 | –15.9 |
| of which cow milk (2) | 137 | 98.1 | 0.0 | –0.8 | –17.0 |
| Eggs | 15 | 121.0 | –8.8 | –7.2 | +7.3 |
- (1) Including vegetables for industry.
- (2)The price for Oct. is not yet known and therefore is estimated by carrying forward the seasonally adjusted price of Sept.
- Sources: INSEE, SSP (ministry in charge of agriculture)
Purchase prices of means of production dipped slightly in October
| Weights | Oct. 2015 | Variation as % over | |||
|---|---|---|---|---|---|
| a month | 3 months | a year | |||
| Total input | 1000 | 109.1 | –0.1 | –0.7 | –1.3 |
| Intermediate consumptions | 764 | 109.9 | –0.2 | –0.8 | –1.8 |
| Energy | 100 | 94.5 | –0.8 | –5.6 | –15.9 |
| Seeds | 57 | 109.8 | +0.8 | +1.1 | +1.3 |
| Fertilisers and soil improvers | 92 | 117.2 | –0.3 | –0.2 | +1.3 |
| Plant protection products | 78 | 100.8 | 0.0 | 0.0 | –0.5 |
| Animal feed | 205 | 116.8 | –0.5 | –0.7 | –0.8 |
| Veterinary expenses | 43 | 115.2 | +0.1 | +0.9 | +2.7 |
| Small equipment and tools | 17 | 109.6 | +0.3 | 0.0 | –0.1 |
| Maintenance of materials | 67 | 113.5 | +0.1 | +0.2 | +1.8 |
| Maintenance of buildings | 9 | 107.0 | 0.0 | +0.1 | –0.1 |
| Other goods and services | 97 | 101.5 | +0.1 | 0.0 | –0.3 |
| Goods and services contributing to investment | 236 | 106.6 | 0.0 | –0.3 | +0.5 |
| Material | 186 | 107.3 | 0.0 | –0.2 | +0.9 |
| Tractors | 79 | 106.8 | –0.2 | –0.7 | +0.9 |
| Machinery and plant for cultivation | 36 | 109.4 | 0.0 | +0.2 | +1.6 |
| Machinery and plant for harvesting | 42 | 107.8 | +0.3 | +0.4 | +1.2 |
| Utility vehicles | 18 | 104.5 | 0.0 | –0.1 | –0.4 |
| Buildings | 50 | 104.1 | 0.0 | –0.7 | –1.2 |
- (1) The repayment of the domestic tax on energy products (TICPE) benefiting farmers has been applied in advance for the year 2015
- Sources: Insee - SSP (ministry in charge of agriculture)
Intermediate consumption prices fell slightly compared to September (–0.2 %). Over one year they fell by nearly 2.0% mostly reflecting the fall in energy prices (-15,9%). Overall capital good prices were unchanged in October.
graphiquemeans – Purchase prices of the means of agricultural production
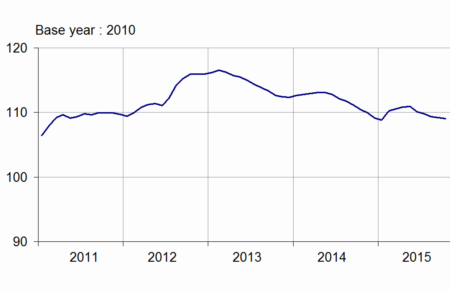
- Sources: INSEE, SSP (ministry in charge of agriculture)
Documentation
Methodology (pdf,122 Ko)
Pour en savoir plus
Time series : Indices of agricultural prices
