


 27 October 2015
2015- n° 262In October 2015, in public works, production capacity remains underused but outlook
has improved Quaterly survey of public works - October 2015
27 October 2015
2015- n° 262In October 2015, in public works, production capacity remains underused but outlook
has improved Quaterly survey of public works - October 2015
According to the business managers surveyed in October 2015, the economic climate in public works remains deteriorated, however, expected activity has improved for the fourth quarter.
According to the business managers surveyed in October 2015, the economic climate in public works remains deteriorated, however, expected activity has improved for the fourth quarter.
The expected activity has improved
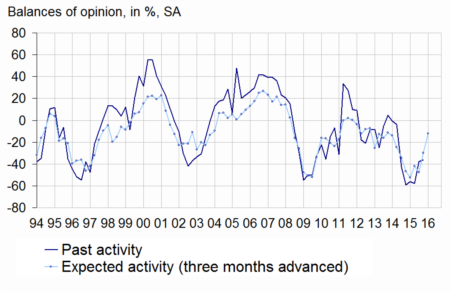
In October 2015, the balance of opinion on past activity has increased a little but it remains far below its long-term average. Business manager are less pessimistic than in July about their expected activity: the corresponding balance of opinion has sharply advanced again and return to a level slightly above its long-term average.
Very few obstacles to production
Obstacles to production remain very low: only 3% of businesses indicate being hampered because of a workforce shortage, against 15% in long-term average. Fewer business managers than in July consider their order books lower than normal for this period of the year but the corresponding balance remains far below its long-term average.
Business managers are still pessimistic about expected workforce
In October 2015, even if the balance of opinion corresponding to expected workforce has improved again, it stays well below its long-term average.
tableautableau1 – Public works economic outlook
| Mean* | Jan. 15 | April 15 | July 15 | Oct. 15 | |
|---|---|---|---|---|---|
| Past activity | –7 | –56 | –58 | –38 | –36 |
| - public-sector project | –13 | –58 | –67 | –50 | –49 |
| - private-sector project | –12 | –45 | –40 | –27 | –17 |
| Expected activity | –15 | –42 | –47 | –30 | –12 |
| - public-sector project | –18 | –49 | –56 | –39 | –23 |
| - private-sector project | –18 | –39 | –36 | –19 | –4 |
| Opinion on order books | –26 | –65 | –68 | –67 | –57 |
| Obstacles to production increase because of workforce shortage (in %) | 15 | 2 | 3 | 1 | 3 |
| Expected workforce | –17 | –45 | –59 | –46 | –38 |
- * Mean since January 1981
- Sources: FNTP and INSEE
graphiqueActivity – Activity tendency in public works
Pour en savoir plus
