


 14 August 2015
2015- n° 199In July 2015, oil prices decreased again Prices of oil and raw material imports - July 2015
14 August 2015
2015- n° 199In July 2015, oil prices decreased again Prices of oil and raw material imports - July 2015
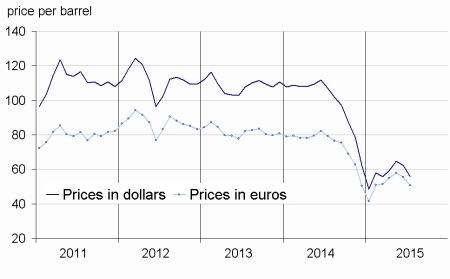
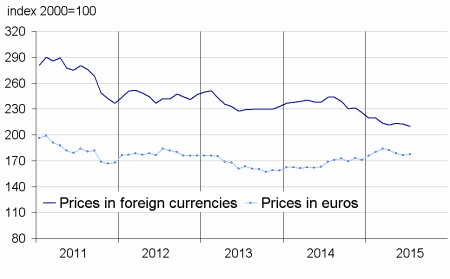
In July 2015, the price of crude oil in euros declined again (–8.7% after –3.9%), to average 50.8€ per barrel of Brent. The price tumbled by 35.9% compared to its level in July 2014, when it stood at 79.2€. Prices in euros of imported commodities except energy increased slightly (+0.6% after –1.1%), due to an uptick in raw food materials (+3.3%), while prices of industrial raw materials fell (–1.7%).
In July 2015, the price of crude oil in euros declined again (–8.7% after –3.9%), to average 50.8€ per barrel of Brent. The price tumbled by 35.9% compared to its level in July 2014, when it stood at 79.2€. Prices in euros of imported commodities except energy increased slightly (+0.6% after –1.1%), due to an uptick in raw food materials (+3.3%), while prices of industrial raw materials fell (–1.7%).
Oil prices in euros went down again
In July, the price of crude oil from the North Sea (Brent) in dollars dropped sharply (–10.4% after –3.4%), as a result of both a very high output in Saudi Arabia and a still high supply in the United States. In euros, the price of crude Brent dipped less sharply (–8.7% after –3.9%), because the euro still depreciated.
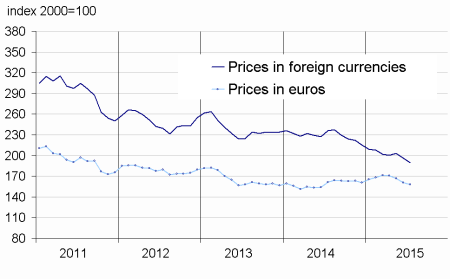
Prices of industrial raw materials kept dropping
In July, prices of industrial raw materials in euros went down again (–1.7% after –3.8% in June), due to a drop in the prices of minerals. Year-on-year, prices decreased (–1.9%), despite the depreciation of the euro.
Prices of minerals kept falling (–2.8% after –5.9%), as a result of a slowdown in the economic activity in China, a country that consumes nearly half of the world’s industrial metals. Thus, prices of non ferrous metals edged down again in July (–0.9% after –7.1%). In particular, prices of copper kept dipping (–7.0% after –6.5%) due to a lower worldwide demand. Among the precious metals, prices of gold, responsive to movements in exchange rates for the American dollar, kept falling (–2.6% after –2.0%). Finally, prices of iron ore fell back sharply (–15.7% after +2.9%, –34.2% over a year), due to a rise in supply though the demand came down, in particular in China.
Prices of agricultural raw materials barely rose (+1.5% after +3.0%), due to an increase in prices of natural fibres (+0.2% after –1.1%), as a result of a shrinkage of the cotton farmland in the United States. On the other hand, prices of hides tumbled (–19.7%).
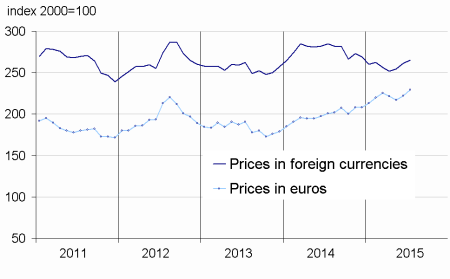
Prices of raw food materials climbed again
In July, prices of raw food materials kept rising (+3.3% after +2.2%), though prices of beef meat edged down (–6.3% after +1.7%). Prices of oil seeds and vegetable oils accelerated (+9.1% after +2.3%), in particular those of olive oil (+7.3% after +0.6%). Prices of palm oil fell back (–3.2% after +0,3%), due to an increase of output in South-East Asia. Prices of cereals recovered (+9.4% after –1.9%), as a result of a decreasing corn supply in the United States. Prices of sugar picked up as well (+3.1% after –8.0%).
tableautabpetrole – Oil and petroleum products
| Prices | Change (%) | |||
|---|---|---|---|---|
| of last month | over the last month | over the last 3 months | over the last 12 months | |
| Brent in $ per barrel | 55.9 | –10.4 | –5.9 | –47.8 |
| Brent in € per barrel | 50.8 | –8.7 | –7.5 | –35.9 |
| Gasoline €/L | 0.48 | 2.3 | 14.5 | –11.9 |
| Gas Oil | 473.6 | –8.4 | –8.5 | –28.1 |
| Heavy fuel | 279.0 | –14.4 | –18.0 | –36.7 |
| Naphtha | 433.0 | –10.5 | –8.4 | –37.7 |
- Prices are in euros per tonne unless otherwise specified
- Source: INSEE
tableautabmatprem – Imported raw materials (excluding energy) in euros
| Index | Changes (%) | |||
|---|---|---|---|---|
| of last month | over the last month | over the last 3 months | over the last 12 months | |
| Food total | 229.4 | 3.3 | 3.6 | 14.2 |
| Tropical foodstuffs | 227.4 | 3.6 | 9.5 | 25.4 |
| Oil seeds, vegetable oils | 259.4 | 9.1 | 8.1 | 12.4 |
| Cereals | 161.0 | 9.4 | 0.9 | 16.9 |
| Sugar | 120.9 | 3.1 | –9.7 | –15.2 |
| Beef meat | 176.3 | –6.3 | –7.6 | 7.9 |
| Industrial raw materials | 158.0 | –1.7 | –7.3 | –1.9 |
| Agricultural raw materials | 117.1 | 1.5 | 0.9 | 10.3 |
| Natural Fibres | 125.6 | 0.2 | –0.4 | 7.0 |
| Natural rubber | 162.9 | –8.1 | –3.3 | –10.5 |
| Hides | 77.2 | –19.7 | –26.2 | –16.3 |
| Wood pulp | 105.0 | 1.9 | –2.8 | 12.7 |
| Tropical wood | 117.9 | 2.0 | 2.4 | 11.8 |
| Sawn softwood | 97.3 | 4.5 | 12.2 | 3.8 |
| Minerals | 180.4 | –2.8 | –10.0 | –5.5 |
| Iron ore | 346.5 | –15.7 | –1.0 | –34.2 |
| Non-ferrous metals | 153.8 | –0.9 | –10.9 | –1.2 |
| Precious metals | 224.9 | –4.6 | –11.9 | –3.4 |
| All commodities | 177.5 | 0.6 | –2.5 | 5.2 |
- Source: INSEE
graphiqueG_petrole_ang – Oil (Brent)
- Source: INSEE
graphiqueG_alim_ang – Food
- Source: INSEE
graphiqueG_ensemble_ang – Imported raw materials (excluding energy)
- Source: INSEE
graphiqueG_indus_ang – Industrial raw materials
- Source: INSEE
Pour en savoir plus
Time series : Raw materials prices
