


 28 December 2012
2012- n° 322Households consumption of goods slightly increased in November (+0.2%) Household consumption expenditure on goods - november 2012
28 December 2012
2012- n° 322Households consumption of goods slightly increased in November (+0.2%) Household consumption expenditure on goods - november 2012
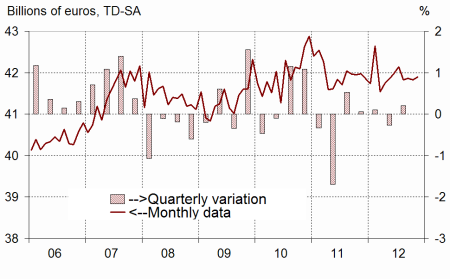
In November, households expenditure on goods increased by 0.2% in volume*, after a -0.1% decrease in October. This increase is mainly attributable to a rise in expenditures on energy products. Car and textile-leather purchases however decreased.
In November, households expenditure on goods increased by 0.2% in volume*, after a -0.1% decrease in October. This increase is mainly attributable to a rise in expenditures on energy products. Car and textile-leather purchases however decreased.
Engineered goods : slightly decreasing
Durables: decreasing
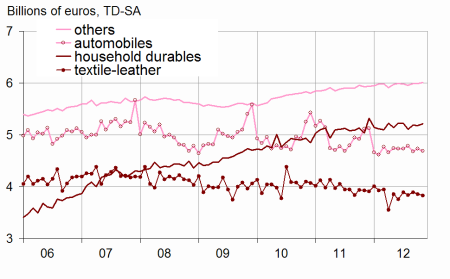
After an increase in October (+0.9%), households expenditure on durable goods bounced back in November (-0.6%), mainly because of the decrease in expenditure on cars (-0.9%, after +1.1%). However purchases in household durables bounced (+0.6%, after -0.1%).
Textile-leather: also decreasing
Households consumption of textile and leather decreased in November (-0.8%, after -1.0%); in particular, purchases on textile (household linen, …) dropped.
Other engineered goods: slightly increasing
Consumption expenditure on other engineered goods slightly increased in November (+0.3%, after a stability in October). Expenditure on hardware especially rose.
graphiquegraph1_new_ang – Total consumption of goods
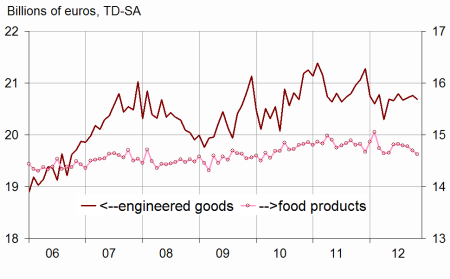
graphiquegraph2_new_ang – Food and engineered goods
graphiquegraph3_new_ang – Decomposition of engineered goods
Food products: still decreasing
The decline in consumption of food products, which started in August, went on in November (–0.5% in October and in November).
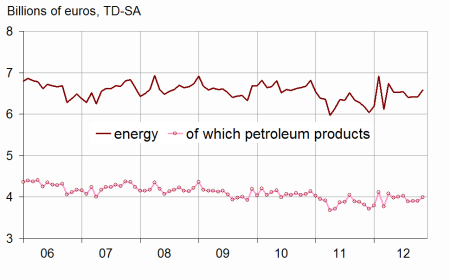
Energy: increasing
After a stability increase in October, households consumption of energy products bounced in November (+2.7%). Consumption of energy for heating purposes (gas, electricity, fuel) is notably stimulated by slightly below average temperatures in the northern part of the country. Moreover, diesel oil consumption increased.
The evolutions of household consumption of goods in September and in October are scaled up by 0.1 point
The change of household consumption of goods is now estimated at +0.1% in September, instead of +0.0% estimated for the previous publication, and at -0.1% in October, instead of a -0.2% estimated for the previous publication
These revisions are mainly due to the integration of new information, notably regarding the expenditures on clothing and durable goods, the scaling up of energy indicators, as well as the updating of the seasonal adjustment coefficients.
tableautab1_eng – Households consumption expenditures on goods
| Sept. | Oct. | Nov. | Nov.12/ | |
|---|---|---|---|---|
| 2012 | 2012 | 2012 | Nov.11 | |
| Food products | 14.778 | 14.700 | 14.626 | |
| Change (%) | –0.1 | –0.5 | –0.5 | –1.3 |
| Engineered goods | 20.711 | 20.763 | 20.690 | |
| Change (%) | 0.2 | 0.2 | –0.3 | –1.8 |
| Of which: | ||||
| Automobiles | 4.680 | 4.732 | 4.690 | |
| Change (%) | –2.1 | 1.1 | –0.9 | –8.3 |
| Household durables | 5.187 | 5.183 | 5.213 | |
| Change (%) | 1.6 | –0.1 | 0.6 | 3.6 |
| Textile-leather | 3.895 | 3.857 | 3.827 | |
| Change (%) | 1.4 | –1.0 | –0.8 | –2.6 |
| Other engineered goods | 5.993 | 5.992 | 6.010 | |
| Change (%) | 0.6 | 0.0 | 0.3 | 1.3 |
| Energy | 6.411 | 6.411 | 6.584 | |
| Change (%) | 0.1 | 0.0 | 2.7 | 6.5 |
| Including petroleum products | 3.900 | 3.908 | 3.997 | |
| Change (%) | 0.3 | 0.2 | 2.3 | 4.9 |
| Total | 41.863 | 41.828 | 41.893 | |
| Change (%) | 0.1 | –0.1 | 0.2 | –0.2 |
| Manufactured goods | 36.225 | 36.233 | 36.175 | |
| Change (%) | 0.1 | 0.0 | –0.2 | –1.0 |
graphiquegraph4_new_ang – Energy
Documentation
Methodology (pdf,23 Ko)
Pour en savoir plus
