


 30 November 2012
2012- n° 296Services Producer Price Indices : Contrasting price movements in the third quarter
of 2012 Services producer price indices - 3rd quarter 2012
30 November 2012
2012- n° 296Services Producer Price Indices : Contrasting price movements in the third quarter
of 2012 Services producer price indices - 3rd quarter 2012
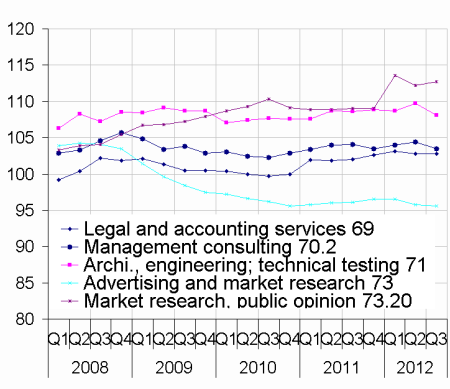
In the third quarter of 2012, services prices fell slightly, most notably for professional, scientific and technical services.
In the third quarter of 2012, services prices fell slightly, most notably for professional, scientific and technical services.
Information and communication
Trends deflected
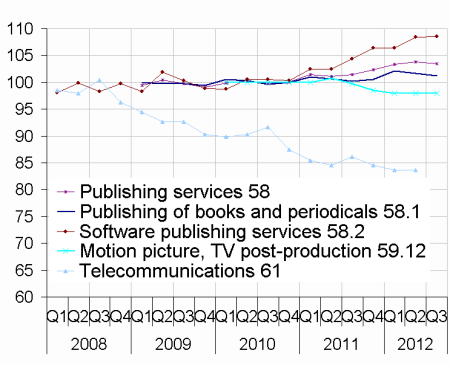
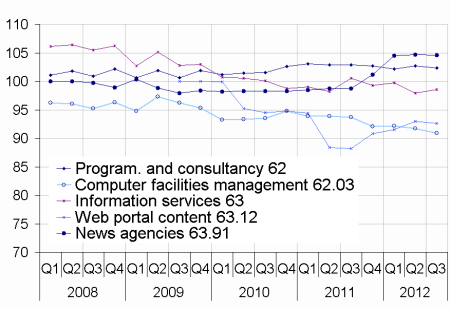
The downward trend of prices for telecommunications (-1.1 % year-over-year) stopped in the second quarter of 2012. On the other hand, prices for edition fell slightly this quarter (-0.3 %), but they increased by 2.1 % year-over-year. Regarding prices for information services, they increased this quarter (+0.7 %) but fell year-over-year by 1.9 %.
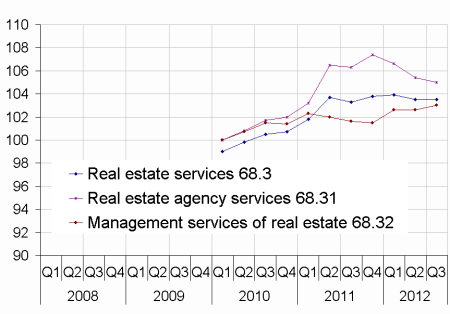
Real estate services
Stability confirmed
Altogether, real estate services prices were stable again this quarter, as over the year. Real estate agencies prices kept declining, contrary to prices for real estate management services which continued to rise.
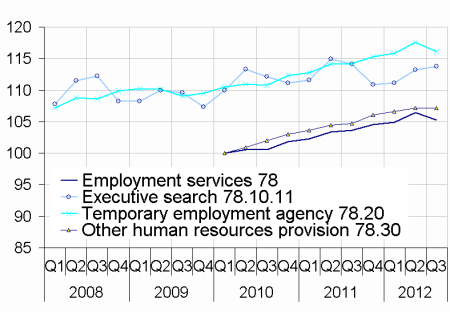
Administrative and support services
Different price movements
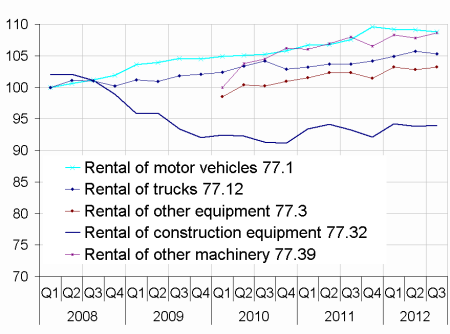
Prices for employment services fell for the first time since 2010 : -1.0 % this quarter but +1.6 % year-over-year. Prices for security and services to buildings and landscape kept increasing (+2.7 % and +2.3 % year-over-year). Prices for rental of motor vehicles have been decreasing since the 4th quarter of 2011 (-0.3 % this quarter), but rose by 1.1 % year-over-year.
A new series is published : Computer programming services 62.01
tableautableau1 – Services Producer Price Indices : French market
| Divisions and groups in CPA rev. 2, 2008 | Weights (M €) | Indices Q3* 2012 | Changes in % | ||
|---|---|---|---|---|---|
| Q/ Q-1 | Q/ Q-4 | ||||
| 38.1 & 38.2 (6) | Waste collection, treatment and disposal | 21 252 | 102 | 0.2 | 1.7 |
| 53.20 (1) | Other postal and courier services | 555 | 98.1 | –1.4 | –1.9 |
| Information and communication | |||||
| 58 (8) | Publishing services | 24 985 | 103.5 | –0.3 | 2.1 |
| 61 (4) | Telecommunications | 12 650 | 83.7 | 0.0 | –1.1 |
| 62 (1) | Computer programming, consultancy and related services | 45 118 | 102.3 | –0.4 | –0.6 |
| 63 (8) | Information services | 10 204 | 98.6 | 0.7 | –1.9 |
| Real estate services | |||||
| 68.3 (8) | Real estate services on a fee or contract basis | 11 632 | 103.5 | 0.0 | 0.2 |
| Professional. scientific and technical services | |||||
| 69 (8) | Legal and accounting services | 32 514 | 102.8 | 0.0 | 0.8 |
| 70.2 (1) | Management consulting | 22 565 | 103.5 | –0.9 | –0.6 |
| 71 (2) | Architectural and engineering services; technical testing and analysis services | 49 881 | 108.1 | –1.5 | –0.5 |
| 73 (3) | Advertising and market research | 19 960 | 95.6 | –0.2 | –0.5 |
| Administrative and support services | |||||
| 77.1 (5) | Rental of motor vehicles | 8 121 | 108.8 | –0.3 | 1.1 |
| 77.3 (8) | Rental of other machinery. equipment and tangible goods | 18 064 | 103.2 | 0.4 | 0.9 |
| 78 (7) | Employment services | 28 623 | 105.3 | –1.0 | 1.6 |
| 80 (1) | Security | 6 581 | 115.7 | 0.3 | 2.7 |
| 81 (7) | Services to buildings and landscape | 19 826 | 102.6 | 0.6 | 2.3 |
| 82.20 (5) | Call centres | 4 864 | 102.8 | 0.4 | –1.2 |
- u : unavailable s : statistical secret
- *: Telecommunications prices are known with one quarter delay.
- Source : INSEE. "Observation des prix de l'industrie et des services aux entreprises" survey
graphiquegraph2_telecom_A – Publishing and telecommunications
graphiquegraph6_pro_A – Professional. scientific and technical services
graphiquegraph3_loc_A – Rental and leasing services
graphiquegraph1_info_A – Computer programming and information
graphiquegraph5_immo_A – Real estate
graphiquegraph4_emploi_A – Employment services
Documentation
Simplified methodology (pdf,134 Ko)
Pour en savoir plus
Time series : Services producer price indices
