


 14 August 2012
2012- n° 200No growth for the third consecutive quarter Quarterly national accounts - second estimate - 2nd quarter 2012
14 August 2012
2012- n° 200No growth for the third consecutive quarter Quarterly national accounts - second estimate - 2nd quarter 2012
In 2012 Q2, French gross domestic product (GDP) in volume* held steady (0.0%).
In 2012 Q2, French gross domestic product (GDP) in volume* held steady (0.0%).
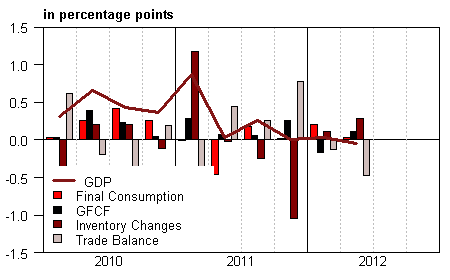
Households’ consumption expenditure slightly declined (–0.2% after +0.2%), while gross fixed capital formation (GFCF) increased anew (+0.6%) after a step back in Q1 (–0.8%). Overall, total domestic demand (excluding changes in inventories) drove GDP on for only 0.1 point of growth after being neutral in Q1.
Imports markedly accelerated (+1.8% after +0.6%), while exports remained subdued (+0.2% after +0.1%). Consequently, foreign trade balance contributed again negatively to GDP growth (–0.5 point after –0.1 point).
In Q2, changes in inventories contributed positively to GDP growth: +0.3 point after +0.1 point in Q2.
Total production leveled off
In Q2, total production in goods and services was flat. Production in manufactured goods stepped back again (–1.0% after –0.9%), particulary in transport equipment (–3.3% after –0.8%). Meanwhile, production in services grew slightly in Q2 (+0.2% as in Q1).
Households’ consumption remained sluggish
In Q2, household’s consumption expenditure slightly stepped back (–0.2% after +0.2%). This decrease was mainly due to textile-leather (–5.3% after +0.3%) and food products (–1.3% after +0.8%). Expenditures in services decreased as well (–0.2% after +0.2%), mostly in accommodation and food services (–1.9% after –0.2%). Energy expenditure grew less rapidly than the previous quarter (+2.7% after +3.5%) but remained dynamic due to relatively cold weather conditions in April.
graphiqueGraph1 – GDP and its main components
tableauTab1 – GOODS AND SERVICES: SUPPLY AND USES CHAIN-LINKED VOLUMES
| 2011 Q3 | 2011 Q4 | 2012 Q1 | 2012 Q2 | 2011 | 2012 (ovhg) | |
|---|---|---|---|---|---|---|
| GDP | 0.3 | 0.0 | 0.0 | 0.0 | 1.7 | 0.2 |
| Imports | 0.5 | -1.6 | 0.6 | 1.8 | 5.2 | 0.8 |
| Households' consumption expenditure | 0.2 | 0.0 | 0.2 | -0.2 | 0.2 | -0.1 |
| General government's consumption expenditure | 0.2 | 0.2 | 0.5 | 0.5 | 0.2 | 1.0 |
| GFCF | 0.3 | 1.3 | -0.8 | 0.6 | 3.5 | 0.8 |
| of which Non financial corporated and unincorporated enterprises | -0.4 | 1.8 | -1.4 | 0.7 | 5.1 | 0.3 |
| Households | 1.2 | 0.5 | -0.4 | 0.0 | 3.2 | 0.9 |
| General government | 0.4 | 1.0 | -0.1 | 0.9 | -1.8 | 1.6 |
| Exports | 1.6 | 1.2 | 0.1 | 0.2 | 5.5 | 2.2 |
| Contributions : | ||||||
| Internal demand excluding inventory changes | 0.2 | 0.3 | 0.0 | 0.1 | 0.9 | 0.4 |
| Inventory changes | -0.2 | -1.0 | 0.1 | 0.3 | 0.8 | -0.6 |
| Net foreign trade | 0.3 | 0.8 | -0.1 | -0.5 | 0.0 | 0.3 |
tableauTab2 – Sectoral accounts
| 2011 Q3 | 2011 Q4 | 2012 Q1 | 2012 Q2 | 2011 | 2012 (ovhg) | |
|---|---|---|---|---|---|---|
| Profit ratio of NFC* (level) | 28.4 | 28.1 | 27.8 | 28.5 | ||
| Household purchasing power | -0.3 | -0.2 | -0.1 | 0.5 | -0.3 |
- *NFC: non-financial corporations
tableauTab3 – GDP and components : prices indices
| 2011 Q3 | 2011 Q4 | 2012 Q1 | 2012 Q2 | 2011 | 2012 (ovhg) | |
|---|---|---|---|---|---|---|
| GDP | 0.3 | 0.5 | 0.2 | 0.6 | 1.3 | 1.3 |
| Imports | 0.8 | 0.9 | 0.7 | -0.7 | 5.4 | 1.3 |
| Cons. Exp. : | ||||||
| - Households | 0.4 | 0.6 | 0.6 | 0.3 | 2.1 | 1.6 |
| - GG* | 0.2 | 0.1 | 0.0 | 0.0 | 1.4 | 0.4 |
| Total GFCF | 0.7 | 0.5 | 0.5 | 0.4 | 2.9 | 1.8 |
| - of which Households | 1.1 | 0.4 | 0.1 | 0.6 | 3.8 | 1.8 |
| - of which NFE | 0.4 | 0.5 | 0.8 | 0.3 | 2.3 | 1.7 |
| - of which GG | 0.7 | 0.9 | 0.6 | 0.4 | 3.6 | 2.0 |
| Exports | 0.3 | 0.4 | 0.6 | -0.3 | 3.2 | 0.8 |
- *GG: General Government
tableauTab4 – Manufactured goods : supply and uses in volume
| 2011 Q3 | 2011 Q4 | 2012 Q1 | 2012 Q2 | 2011 | 2012 (ovhg) | |
|---|---|---|---|---|---|---|
| Industrie’s production | -0.1 | 0.0 | -0.9 | -1.0 | 3.2 | -1.9 |
| - of which value added | -0.2 | -0.7 | -0.6 | -0.7 | 0.7 | -2.0 |
| Imports | 0.3 | -2.0 | 1.7 | 2.6 | 6.7 | 2.2 |
| Intermediate uses | 0.2 | 0.2 | -0.2 | -0.5 | 2.9 | -0.4 |
| Cons. Exp. : | ||||||
| - of households | 0.3 | 0.3 | -0.7 | -0.5 | 0.9 | -1.0 |
| - of GG | 1.2 | 0.4 | 1.7 | 1.5 | 3.6 | 4.0 |
| Total GFCF | -1.1 | 2.5 | -3.5 | 0.2 | 7.3 | -2.1 |
| - of which NFC | -1.4 | 2.8 | -3.9 | 0.2 | 7.6 | -2.5 |
| - of which GG | 0.6 | 0.6 | 0.6 | 0.5 | -0.5 | 1.9 |
| Exports | 1.5 | 1.5 | 1.2 | 0.3 | 4.5 | 3.4 |
| Inventory changes (contribution) | -0.9 | -2.7 | 0.1 | 0.8 | 1.9 | -1.8 |
tableauTab5 – Households’ disposable income and ratios of households’ account
| 2011 Q3 | 2011 Q4 | 2012 Q1 | 2012 Q2 | 2011 | 2012 (ovhg) | |
|---|---|---|---|---|---|---|
| HDI | 0.1 | 0.4 | 0.5 | 2.6 | 1.1 | |
| Household purchasing power | -0.3 | -0.2 | -0.1 | 0.5 | -0.3 | |
| HDI by cu* (purchasing power) | -0.5 | -0.4 | -0.2 | -0.1 | -0.7 | |
| Adjusted HDI (purchasing power) | -0.2 | -0.1 | 0.0 | 0.8 | -0.1 | |
| Saving rate (level) | 16.2 | 16.1 | 15.9 | 16.2 | ||
| Financial saving rate (level) | 7.1 | 6.9 | 6.7 | 7.1 |
- *cu: consumption unit
tableauTab6 – Ratios of non-financial corporations’ account
| 2011 Q3 | 2011 Q4 | 2012 Q1 | 2012 Q2 | 2011 | |
|---|---|---|---|---|---|
| Profit share | 28.4 | 28.1 | 27.8 | 28.5 | |
| Investment ratio | 20.0 | 20.3 | 20.2 | 20.1 | |
| Savings ratio | 13.0 | 13.0 | 13.0 | 13.5 | |
| Self-financing ratio | 65.4 | 64.1 | 64.0 | 66.9 |
Total GFCF renewed with growth
After a step back in Q1 (–0.8%), total GFCF increased anew in Q2 (+0.6%). Non-financial corporations’ GFCF upturned (+0.7% after –1.4%) after a drop in Q1, in particular in transport equipment.
Public administrations’ investment rose (+0.9% after –0.1%): these investments got back to normal in civil engineering after undergoing harsh weather conditions in Q1.
Households’ GFCF remained sluggish in Q2 (0.0%) after a slight decrease in Q1.
Foreign trade balance weighed down GDP growth
In Q1, imports accelerated (+1.8% after +0.6%). This growth is mainly due to importations of transport equipment (+8.0% after –2.3%). At the same time, exportations’ growth was still moderate (+0.2% after +0.1%). In particular, exportations outside the European Union stepped back. Hence, foreign trade balance weighed down a little more on GDP growth (–0.5% after –0.1 in Q1).
Changes in inventories contributed positively to GDP growth
Changes in inventories contributed positively to GDP growth: +0.3 point after +0.1 point. This contribution was mainly due to coke and refined petroleum (+0.2 point of contribution) and transport equipment (+0.1 point).
Revisions
GDP growth in 2012 Q1 is still estimated at 0.0%. However, GDP growth in 2011 Q4 is slightly scaled down and its rounded value switched to 0.0%, against +0.1% in the previous publication. This revision is mainly imputable to that of industrial production index.
Pour en savoir plus
Time series : Operations on goods and services
Time series : Gross domestic product balance
Time series : Institutional sector accounts
Time series : Branch accounts
