


 8 November 2011
2011- n° 272In October 2011, the decline of the prices in the imported commodities increased Prices of oil and raw material imports - November 2011
8 November 2011
2011- n° 272In October 2011, the decline of the prices in the imported commodities increased Prices of oil and raw material imports - November 2011
In October, the price of oil in dollars fell (-2.0%) after a slight increase in September (+0,6%). It stood at $108.5 per barrel Brent. Meanwhile, the lower prices in foreign currencies for non-energy commodities imported into France increased significantly (-6.2% after -3.0% in September).
In October, the price of oil in dollars fell (-2.0%) after a slight increase in September (+0,6%). It stood at $108.5 per barrel Brent. Meanwhile, the lower prices in foreign currencies for non-energy commodities imported into France increased significantly (-6.2% after -3.0% in September).
The price of oil fell off again
In October, the dollar price of oil from the North Sea (Brent) fell (-2.0% after +0.6%). In euros, the decline in the oil price was slightly (-1.7% after +4.7% in September), due to the depreciation of European currency against the dollar (-0.3%). On the last three months, the price of oil has fallen by 6.9% in dollars and 3.1% in euros.
The lower prices of industrial raw materials accelerated
In October, the decline in foreign currencies prices of industrial raw materials has accentuated (-6.3% after -3.1% in September). The prices of mineral raw materials have continued to hold up (-7.1% after -4.2%). The prices of all nonferrous metals registered sharp declines (-8.4% after -5.6%), particularly those of copper (-11.6%), zinc (-10.3%) and aluminum (-5.4%). Similarly, the decline in prices of precious metals has clearly accelerated (-11.4% after -2.7%), including that of silver (-16.2%) and platinum (-12.2%).
The prices of agro-industrial raw materials also fell (-4.0% after +0.3% in September), mainly due to the lower prices of natural rubber (-7.5%), sawn timber of conifers (-5.8%) and natural textiles fibers (-5.9% after +1,3% September).
The lower prices of raw food materials continued
In October, the prices of raw food materials in foreign currencies continued to decline (-5.9% after -2.7%). This oilseeds prices also continued to decline (-8.3% after -3.5%), including soybean meal (-9.9%), soybean (-9.1%°), and palm oil (-8.2%). The decline in tropical foodstuff prices has accentuated (-7.1% after -3.6%). In particular, the improved prospects for crops has reduced the prices of coffee (-10.5% for Arabica; -5.4% for Robusta) and cocoa (-5.8%).
The cereals prices also fell (-2.8% after +2.7%) especially the prices of corn (-8.3%). Finally, the prices of beef meat were down again (-1.7% after -2.8%).
tableautabpetrole – Oil and petroleum products
| Prices | Change (%) | |||
|---|---|---|---|---|
| over the last month | over the last month | over the last 3 months | over the last 12 months | |
| Brent in $ per barrel | 108,5 | –2,0 | –6,9 | 31,3 |
| Brent in € per barrel | 79,1 | –1,7 | –3,1 | 33,0 |
| Gasoline | 971,3 | –5,1 | –7,9 | 27,1 |
| Gas Oil | 930,5 | –0,7 | –4,0 | 30,4 |
| Heavy fuel | 616,8 | –1,8 | –2,6 | 38,9 |
| Naphtha | 962,8 | 0,0 | –7,3 | 28,4 |
- Prices are in dollars per tone unless otherwise specified
- Source : INSEE
tableautabmatprem – Imported raw materials (excluding energy) in domestic currency
| Index | Changes (%) | |||
|---|---|---|---|---|
| over last month | over the last 3 months | over the last 12 months | ||
| Food total | 247,7 | –5,9 | –8,2 | 4,0 |
| Tropical beverages | 257,2 | –7,1 | –12,1 | 4,5 |
| Oil seeds, vegetable oils | 254,3 | –8,3 | –11,9 | –3,2 |
| Cereals | 301,2 | –2,8 | 6,7 | 17,7 |
| Sugar | 322,9 | –5,1 | –10,8 | –2,4 |
| Beef meat | 154,7 | –1,7 | –2,5 | 12,8 |
| Industrial raw materials | 241,0 | –6,3 | –11,9 | –4,2 |
| Agricultural raw materials | 154,1 | –4,0 | –6,1 | 0,3 |
| Natural Fibers | 228,0 | –5,9 | –11,6 | –7,1 |
| Natural rubber | 518,7 | –7,5 | –5,9 | 9,3 |
| Hides | 99,3 | –3,5 | –7,1 | –12,4 |
| Wood pulp | 138,6 | –1,6 | –6,1 | –2,0 |
| Tropical wood | 156,9 | –0,2 | –1,5 | 7,2 |
| Sawn softwood | 91,8 | –5,8 | –6,6 | –3,9 |
| Minerals | 286,7 | –7,1 | –13,8 | –5,7 |
| Iron ore | 615,1 | 0,0 | 0,0 | –2,7 |
| Non-ferrous metals | 239,3 | –8,4 | –18,4 | –10,5 |
| Precious metals | 425,7 | –11,4 | –7,4 | 24,1 |
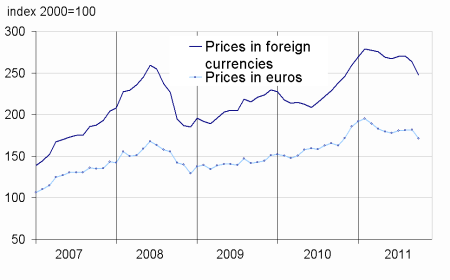
| All commodities | 234,1 | –6,2 | –10,6 | –1,3 |
- Source : INSEE
graphiqueG_alim_ang – OilFood
- Source : INSEE
graphiqueG_ensemble_ang – All commodities
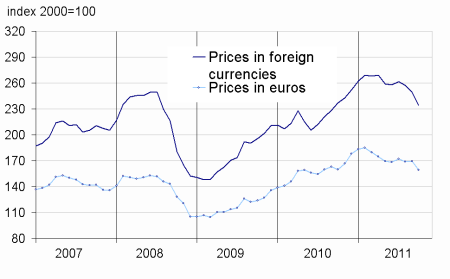
graphiqueG_indus_ang – Industrial raw materials

Pour en savoir plus
Time series : Raw materials prices
