


 11 May 2012
2012- n° 118In manufacturing industry, business managers continue to forecast a dynamic investment
in 2012 : +6% comparing to 2011 Industrial investment survey - April 2012
11 May 2012
2012- n° 118In manufacturing industry, business managers continue to forecast a dynamic investment
in 2012 : +6% comparing to 2011 Industrial investment survey - April 2012
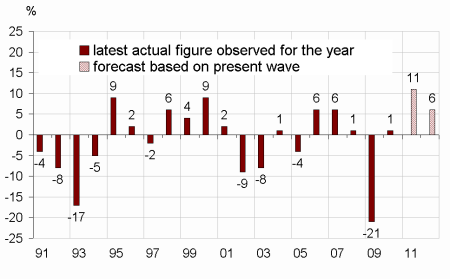
Surveyed in April 2012, business managers report that investment in manufacturing industry increased by 11% in 2011 comparing to 2010. They revised 1 point up-wards their estimation given last January.
- For 2012, industrials still anticipate a dynamic investment
- Investment would still increase in H1 and H2 2012 but more moderately
- In 2012, investment would be more purposed to safety, environment, working conditions
- In 2012, the share of enterprises reporting equipment scrapping would still be smaller than usual
- The investment revision indicator lift up
Surveyed in April 2012, business managers report that investment in manufacturing industry increased by 11% in 2011 comparing to 2010. They revised 1 point upwards their estimation given last January.
graphiqueGraph1_ang – Annual nominal change in investment in manufacturing industry
For 2012, industrials still anticipate a dynamic investment
In April, business leaders in manufacturing industry revised by 1 point upwards the rebound of their investment for 2012 comparing to the previous survey, in January. They forecast an increase by 6% comparing to 2011. This downwards revision concern all sectors except those of manufacture of transport equipment (+2 points) and especially the sector of motor vehicles (+9 points). In this sector, the rebound in investment would be sharp in 2012 (+28% after -3% in 2011). Beside, the increase of investment would continue in the sectors of manufacture of food products and beverages (+6% after +7%) and in sectors of electrical, electronic and machine equipment (+7% as in 2011). On the contrary, in other manufacturing’s sectors investment would be sharply less important in 2012 (+2%) than in 2011 (+15%).
tableauTab1_ang – Real annual investment growth
| NA* : (A17) and [A38] | 2011 | 2012 | ||
|---|---|---|---|---|
| estimate Jan.12 | observed Apr.12 | estimate Jan.12 | estimate Apr.12 | |
| MANUFACTURING INDUSTRY | 10 | 11 | 7 | 6 |
| (C1): Manufacture of food products and beverages | 4 | 7 | 8 | 6 |
| (C3): Electrical and electronic equipment; machine equipment | 4 | 7 | 9 | 7 |
| (C4): Manufacture of transport equipment | 8 | 5 | 15 | 17 |
| [CL1]: Motor vehicles | –1 | –3 | 19 | 28 |
| (C5): Other manufacturing | 13 | 15 | 3 | 2 |
| Total sectors C3-C4-C5 | 11 | 12 | 6 | 5 |
- How to read this table : In manufacturing industry, firms surveyed in April 2012 observed an increase by 11% of their nominal investment in 2011 comparing to 2010 and forecast an increase of 6% in 2012 comparing to 2011.
- * The codes correspond to the level of aggregation (A17) and [A38] of the "NA" aggregate classification based on NAF rev.2.
Investment would still increase in H1 and H2 2012 but more moderately
Comparing to H2 2011, business leaders report a less important rise of their investment in H1 2012. They anticipate also a more moderated rise in H2 2012 comparing to H1 2012.
graphiqueGraph2_ang – Six-month change in investment (first estimation*)
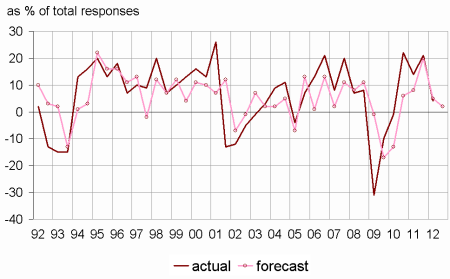
- * See technical note "A new six-month change estimation", Information Rapide Survey of Industrial Investment - July 2010
In 2012, investment would be more purposed to safety, environment, working conditions
According to business leaders in manufacturing industry, the share of purposes of investment would slightly change in 2012 comparing to 2011. The proportion of investment purposed to replacement would decrease by 2 points at 27%, a level closed to its long-term average (26%). The share of investment purposed to increase in productive capacity would also decrease (14% after 15% in 2011). On the contrary, industrials would increase the share of investment purposed to safety, environment, working conditions (22% after 20%) or purposed to automation (9% after 20%).
tableauTab2_ang – Share of purposes of investment
| Average | 2011 | 2012 | |
|---|---|---|---|
| 1991-2010 | observed | forecast | |
| Replacement | 26 | 29 | 27 |
| Modernization, streamlining | 24 | 23 | 24 |
| of which : automation | 11 | 8 | 9 |
| of which : new production methods | 7 | 7 | 7 |
| of which : energy savings | 6 | 8 | 8 |
| increase in productive capacity | 16 | 15 | 14 |
| Introduction of new products | 14 | 13 | 13 |
| Other purposes (safety, environment, working conditions…) | 20 | 20 | 22 |
In 2012, the share of enterprises reporting equipment scrapping would still be smaller than usual
Business leaders in manufacturing industry are a little more optimistic concerning the change in productive capacity for 2012: the corresponding balance of opinion is 4 points higher than the balance of opinion for 2011, but this balance of opinion is still lower than its long-term average (33%).
According to the forecast of business leaders, only 65% of enterprises would do equipment scrapping in 2012 vs. 68% in 2011 and 77% in average. The rate of equipment scrapping for wear and tear, and obsolescence would decrease by 4 points at 50%. On the contrary, the share of equipment scrapping due to shut-down of capacity for old products would increase by 3 points at 18% vs. 12% in average. The share of equipment scrapping due to installation of more efficient equipment would stay at a low level : 27% vs. 32% in average.
tableauTab3a_ang – Productive capacity and equipment scrapping
| Observed | Forecast | |||
|---|---|---|---|---|
| aver. | in 2011 | aver. | for 2012 | |
| Change in productive capacity* | 32 | 19 | 33 | 23 |
| Change in equipment scrapping* | 19 | 16 | –3 | –4 |
| Share of enterprises reporting equipment scrapping* | 77 | 68 | 76 | 65 |
| Breakdown of enterprises reporting equipment scrapping** | ||||
| Wear and tear, obsolescence | 51 | 54 | 48 | 50 |
| Installation of more efficient equipment | 32 | 27 | 34 | 27 |
| Shut-down of capacity for old products | 12 | 15 | 12 | 18 |
| Other scrapping | 6 | 4 | 7 | 5 |
| Total | 100 | 100 | 100 | 100 |
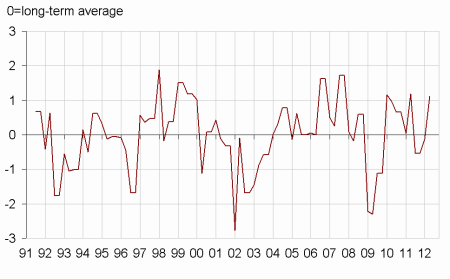
The investment revision indicator lift up
The investment revision indicator lift up. That suggest that investment will increase at Q2 2011. Based on investment amounts filled in at each survey by business leaders of manufacturing industry except those of manufacture of food products and beverages (C1) and of coke and refined petroleum products (C2), this indicator is well-correlated with quarterly growth fixed capital formation of non-financial enterprises.
graphiqueGraphIR_ang – Investment revision indicator *
Documentation
Methodology (pdf,34 Ko)
Pour en savoir plus
Time series : Industry – Investment
