


 8 February 2012
2012- n° 38In January 2012, the prices of the imported commodities on the rise again Prices of oil and raw material imports - January 2012
8 February 2012
2012- n° 38In January 2012, the prices of the imported commodities on the rise again Prices of oil and raw material imports - January 2012
In January, the price of oil in dollars rebounded (+3.2% after –2.4% in December). It stood at $111.5 per barrel Brent. The foreign currency prices for non-energy commodities imported into France are also started to increase (+2.6% after –2.2% in December).
In January, the price of oil in dollars rebounded (+3.2% after –2.4% in December). It stood at $111.5 per barrel Brent. The foreign currency prices for non-energy commodities imported into France are also started to increase (+2.6% after –2.2% in December).
The prices of oil in dollars recovered
In January, the dollar price of oil from the North Sea (Brent) has rebounded (+3.2% after -2.4%). In euros, the increase in the oil prices was stronger (+5.2 % after +0.6 %), due to the depreciation of European currency against the dollar (-1.9)
The prices of industrial raw material rebounded
In January, the prices of industrial raw materials in foreign currencies increased (+3.0% after -1.6% in December). On the one hand, the prices of mineral raw materials rebounded (+4.2% after -1.6%). Indeed, the prices of nonferrous metals rose sharply (+6.1% after –1.2%), primarily copper (+6.3%), aluminium (+6.1%) and nickel (+9.1%). Similarly, the prices of precious metals are starting to rebound (+1.8% after -6.3%), including silver (+1.2% after -8.1%) and platinum (+2.7% after –8.1%). The gold prices have stabilized, however (+0.2% after –5.0%).
In the other hand, the prices of agro-industrial raw materials decreased (-0.4% after -1.4% in December). Indeed the decline of wood pulp (-4.3%) was partly offset bty the rebound in natural rubber prices (+2.0% after -1.1%) and those of natural textile fibers (+5.4% after -7.5%), especially cotton (+6.2% after –9.1%).
The prices of raw food materials on the rise again
In January, the prices of raw food materials in foreign currencies are starting to rebound (+2.2% after -3.2% in December). The prices of tropical foodstuff recovered (+2.1% after -6.3%), notably cocoa (+8.5% after –13.7%),
and tea (+8.7% after –1.7%). Similarly, the price of the beef meal rebounded (+2.4% after –0.2%), as well as oilseeds (+3.4% after –1.9%), including soybean meal (+5.2% after –2.3%). Only the cereals prices continued to decline, but less strongly than in December (-1.5% after –4.5%).The decrease in the rice prices (-7.2%) was offset by higher maize prices (+4.8%).
tableautabpetrole – Oil and petroleum products
| Prices | Change (%) | |||
|---|---|---|---|---|
| of last month | over the last month | over the last 3 months | over the last 12 months | |
| Brent in $ per barrel | 111,5 | 3,2 | 2,8 | 15,7 |
| Brent in € per barrel | 86,5 | 5,2 | 9,3 | 19,9 |
| Gasoline | 974,7 | 6,2 | 0,4 | 16,3 |
| Gas Oil | 950,9 | 2,7 | 2,2 | 18,4 |
| Heavy fuel | 655,6 | 8,2 | 6,3 | 36,5 |
| Naphtha | 945,5 | 8,1 | 7,4 | 10,8 |
- Prices are in dollars per tonne unless otherwise specified
- Source: INSEE
tableautabmatprem – Imported raw materials (excluding energy) in domestic currency
| Index | Changes (%) | |||
|---|---|---|---|---|
| over the last month | over the last 3 months | over the last 12 months | ||
| Food total | 243,6 | 2,2 | –2,2 | –9,6 |
| Tropical foodstuff | 235,3 | 2,1 | –8,4 | –16,5 |
| Oil seeds, vegetable oils | 260,3 | 3,4 | 0,5 | –13,3 |
| Cereals | 284,9 | –1,5 | –5,4 | 2,5 |
| Sugar | 295,2 | 2,7 | –8,6 | –25,1 |
| Beef meat | 163,4 | 2,4 | 5,6 | 7,2 |
| Industrial raw materials | 234,7 | 3,0 | –0,3 | –14,3 |
| Agricultural raw materials | 144,5 | –0,4 | –6,3 | –17,8 |
| Natural Fibers | 214,1 | 5,4 | –6,3 | –37,1 |
| Natural rubber | 434,3 | 2,0 | –16,3 | –33,1 |
| Hides | 89,9 | –0,2 | –9,5 | –21,4 |
| Wood pulp | 124,0 | –4,3 | –10,5 | –10,6 |
| Tropical wood | 147,6 | 0,0 | –5,9 | –2,0 |
| Sawn softwood | 98,5 | 2,2 | 7,3 | –17,5 |
| Minerals | 282,9 | 4,2 | 1,9 | –13,1 |
| Iron ore | 522,5 | 0,0 | 0,0 | –18,0 |
| Non-ferrous metals | 247,0 | 6,1 | 3,2 | –14,5 |
| Precious metals | 421,6 | 1,8 | –1,0 | 9,6 |
| All commodities | 228,7 | 2,6 | –1,1 | –12,7 |
- Source: INSEE
graphiqueG_petrole_ang – Oil

- Source: INSEE
graphiqueG_alim_ang – Food
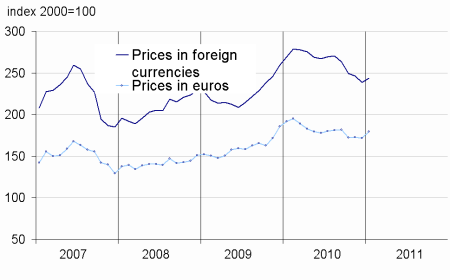
- Source: INSEE
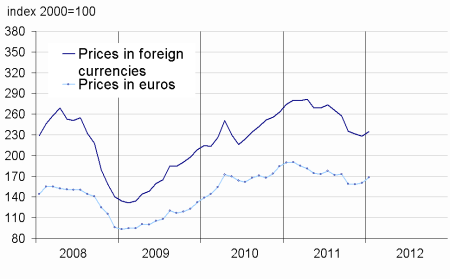
graphiqueG_ensemble_ang – All commodities
- Source: INSEE
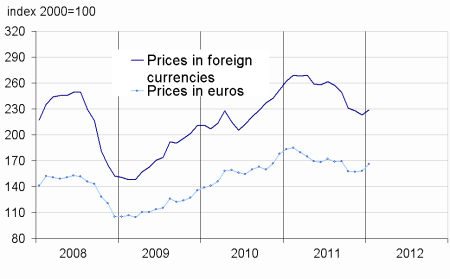
graphiqueG_indus_ang – Industrial raw materials
- Source: INSEE
Pour en savoir plus
Time series : Raw materials prices
