


 7 October 2011
2011- n° 247In September 2011, prices of the imported commodities were down again Prices of oil and raw material imports - Septembre 2011
7 October 2011
2011- n° 247In September 2011, prices of the imported commodities were down again Prices of oil and raw material imports - Septembre 2011
In September, the price of oil in dollars rose slightly (+0.6%) after having fallen sharply in August (-5,5%). It stood at $110.8 per barrel Brent. The foreign currency prices for non-energy commodities imported into France declined again (-3.0% after -1.8% in August).
In September, the price of oil in dollars rose slightly (+0.6%) after having fallen sharply in August (-5,5%). It stood at $110.8 per barrel Brent. The foreign currency prices for non-energy commodities imported into France declined again (-3.0% after -1.8% in August).
The price of oil recovered slightly
In September, the dollar price of oil from the North Sea (Brent) increased slightly (+0.6% after -5.5%). In euros, the oil price recovered strongly (+4.7% after -5.8% in august), due to the depreciation of European currency against the dollar (-3.9%). In one year, the rise in oil prices reached 42.4% in dollars and 35.4% in euros).
The prices of industrial raw materials continued to decline
In September, the prices of industrial raw materials in foreign currencies continued to decline (-3.1% after -3.0%). The prices of mineral raw materials still decreased (-4.2% after -3.1%). Indeed, the prices of nonferrous metals fell as much as in August (-5.6%), especially those of copper (-8.0%), nickel (-7,7%) and zinc (-5.5%). The prices of precious metals have also decreased (-2.7% after +7.4%), mainly those of palladium (-7.6%), silver (-5.3%) and platinum (-3.1%).
The prices of agro-industrial raw materials increased slightly (+0.3% after -2.5% in August), mainly due to the sharp rise in the price of sawn timber of conifers (+8.2% after -8.4%). Meanwhile, the prices of natural textiles fibers also increased (+1,3% after -7,2%), due to the rebound in cotton prices (+2.8% after -6.7%).
The prices of raw food materials decreased
In September, the prices of raw food materials in foreign currencies decreased (-2.7% after +0.3%). This is particularly the case of tropical foodstuff which recorded a 3.6% decrease due to the decline in the prices of cocoa (-6.1%) and tea (-5.1%). With regard to cocoa, the surplus of harvest in major producing countries of West Africa, including Ivory Coast, has weighed on the prices. The prices of sugar fell again (-4.1% after -2.0%) because of the anticipated increase in supply in Brazil and India. The prices of oilseeds
have fallen sharply (-3.5% after -0.5%) due to the lower prices of palm oil (-4.8%) and soybeans (-4.5% for soybean and -3.7% for soybean meal). Similarly, the prices of beef meat were down (-2.8% after +1.9%). In contrast, the prices of imported cereals continued to rise, but less strongly than in August (+2.7% after +6.8%), mainly due to the increase in the prices of rice (+8.1%) sustained by Asian demand.
tableautabpetrole – Oil and petroleum products
| Prices | Change (%) | |||
|---|---|---|---|---|
| over the last month | over the last month | over the last 3 months | over the last 12 months | |
| Brent in $ per barrel | 110,8 | 0,6 | –2,8 | 42,4 |
| Brent in € per barrel | 80,4 | 4,7 | 1,7 | 35,4 |
| Gasoline | 1023,9 | 1,2 | 1,6 | 45,0 |
| Gas Oil | 936,7 | –0,3 | –0,6 | 39,3 |
| Heavy fuel | 627,9 | 0,8 | 3,2 | 50,0 |
| Naphta | 963,0 | –7,3 | –7,3 | 42,5 |
- Prices are in dollars per tonne unless otherwise specified
- Source : INSEE
tableautabmatprem – Imported raw materials (excluding energy) in domestic currency
| Index | Changes (%) | |||
|---|---|---|---|---|
| over last month | over the last 3 months | over the last 12 months | ||
| Food total | 263,1 | –2,7 | –1,5 | 15,1 |
| Tropical beverages | 276,9 | –3,6 | –3,6 | 15,5 |
| Oil seeds, vegetable oils | 277,3 | –3,5 | –4,5 | 11,3 |
| Cereals | 309,8 | 2,7 | 7,1 | 31,2 |
| Sugar | 340,1 | –4,1 | 6,3 | 16,8 |
| Beef meat | 157,3 | –2,8 | 0,7 | 12,9 |
| Industrial raw materials | 257,3 | –3,1 | –4,2 | 6,3 |
| Agricultural raw materials | 160,6 | 0,3 | –0,8 | 8,8 |
| Natural Fibers | 242,6 | 1,3 | –20,5 | 18,4 |
| Natural rubber | 560,8 | 0,9 | 0,8 | 32,1 |
| Hides | 102,9 | –3,8 | –4,5 | –7,3 |
| Wood pulp | 140,9 | –4,0 | –4,5 | –0,6 |
| Tropical wood | 157,2 | –1,8 | –1,9 | 8,0 |
| Sawn softwood | 97,4 | 8,2 | 8,0 | 8,2 |
| Minerals | 308,7 | –4,2 | –5,3 | 5,3 |
| Iron ore | 615,1 | 0,0 | –1,2 | –13,6 |
| Non-ferrous metals | 261,2 | –5,6 | –8,6 | 4,5 |
| Precious metals | 480,7 | –2,7 | 8,5 | 50,8 |
| All commodities | 249,5 | –3,0 | –3,2 | 9,3 |
- Source : INSEE
graphiqueG_petrole_ang – Oil

- Source : INSEE
graphiqueG_alim_ang – Food
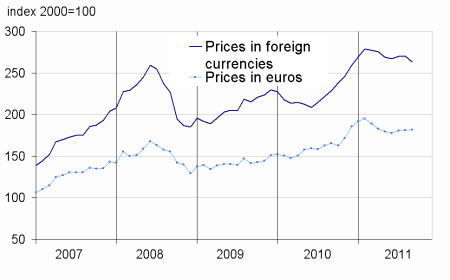
- Source : INSEE
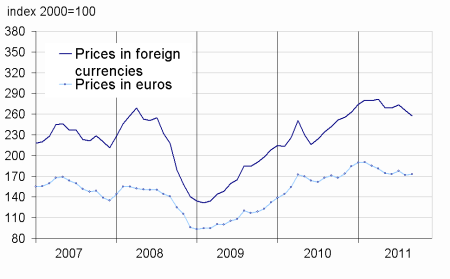
graphiqueG_ensemble_ang – All commodities
- Source : INSEE
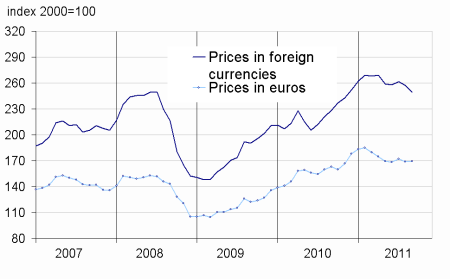
graphiqueG_indus_ang – Industrial raw materials
- Source : INSEE
Pour en savoir plus
Time series : Raw materials prices
