


 16 August 2012
2012- n° 204In July 2012, the prices of imported raw materials rebounded Prices of oil and raw material imports - July 2012
16 August 2012
2012- n° 204In July 2012, the prices of imported raw materials rebounded Prices of oil and raw material imports - July 2012
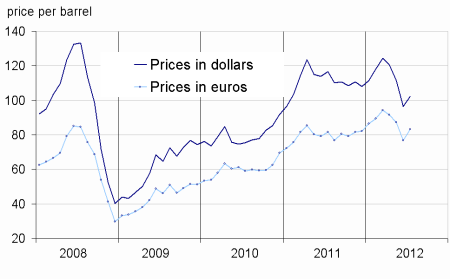
In July, the price of oil in dollars rebounded sharply(+6.0% after –13.5% in June). It stood at $102.3 per barrel of Brent. Meanwhile, the foreign currency prices for non-energy commodities imported into France have significantly rebounded (+2.2% after –3.2% in June).
In July, the price of oil in dollars rebounded sharply (+6.0% after –13.5% in June). It stood at $102.3 per barrel of Brent. Meanwhile, the foreign currency prices for non-energy commodities imported into France have significantly rebounded (+2.2% after –3.2% in June).
The oil prices rose sharply
In July, the dollar price of oil from the North Sea (Brent) has increased strongly (+6.0% after -13.5%). In euros, the rise in oil prices was more pronounced (+8.2% after –11.8 %), due to the depreciation of the euro against the dollar (-2.0%).
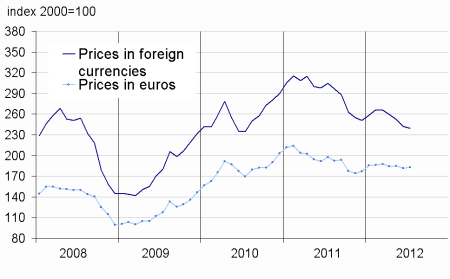
The prices of industrial raw material continued to fall
In July, the prices of industrial raw materials in foreign currencies continued to fall (-1.0% after -4.0% in June). The prices of mineral raw materials has recorded a smaller drop than in June (-1.1% after -4.1%). The prices of nonferrous metals were flat (+0.0% after –5.3%), despite the rise in copper prices (+2.3%). However, the decline in the prices of precious metals was higher than in June (-1.2% after –0.6%), including those of silver (-2.2%) and palladium (-5.4), whose decline in prices was strongly linked to the deteriorating outlook of the global automotive industry.
On the other hand, the prices of agro-industrial raw materials have continued to decline (-0.9% after –3.6%) with a further decline in the prices of sawn softwood of conifers (-1.9% after –1.8%).
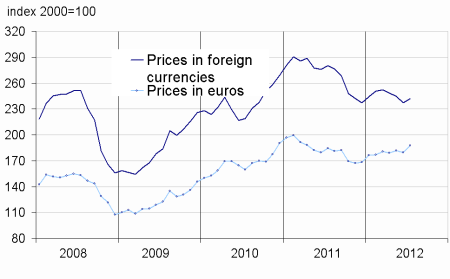
The prices of raw food materials rebounded sharply
In July, the prices of raw food materials in foreign currencies were significantly higher (+7.7% after -1.8%). Indeed, higher prices of oilseeds (+15.8% after -0.4% ; particular, the soybean : +17.2% and soybean meal : +22.0%), and cereals (+5.6% after –1.4%, mainly corn : +28.9%), were supported by the drought that reduced harvests in the United States. Similarly, the prices of tropical foodstuffs have rebounded sharply (+4.9% after –4.1%), due to higher prices of cocoa (+3.7%) and especially of arabica (+14.8%). The prices of sugar have significantly accelerated (+11.3% after +1.0%). Indeed, untimely rains in Brazil, world’s largest exporter of sugar, hampered the harvest.
tableautabpetrole – Oil and petroleum products
| Prices | Change (%) | |||
|---|---|---|---|---|
| Over the last month | over the last month | over the last 3 months | over the last 12 months | |
| Brent in $ per barrel | 102,3 | 6,0 | –15,3 | –12,3 |
| Brent in € per barrel | 83,2 | 8,2 | –9,2 | 2,0 |
| Gasoline $/L | 0,7 | 5,2 | –14,1 | –8,8 |
| Gas Oil | 890,1 | 5,5 | –11,4 | –8,1 |
| Heavy fuel | 634,2 | 6,3 | –14,5 | –8,1 |
| Naphtha | 824,9 | 12,7 | –20,3 | –15,7 |
- Prices are in dollars per tonne unless otherwise specified
- Source : INSEE
tableautabmatprem – Imported raw materials (excluding energy) in domestic currency
| Index | Changes (%) | |||
|---|---|---|---|---|
| over the last month | over the last 3 months | over the last 12 months | ||
| Food total | 274,7 | 7,7 | 6,7 | 1,8 |
| Tropical foodstuff | 227,0 | 4,9 | 1,5 | –21,9 |
| Oil seeds, vegetable oils | 362,1 | 15,8 | 16,9 | 26,2 |
| Cereals | 315,1 | 5,6 | 6,4 | 11,6 |
| Sugar | 279,4 | 11,3 | –1,0 | –22,8 |
| Beef meat | 158,7 | –5,0 | –4,8 | 0,0 |
| Industrial raw materials | 239,5 | –1,0 | –7,8 | –21,4 |
| Agricultural raw materials | 143,3 | –0,9 | –3,3 | –12,7 |
| Natural Fibers | 175,6 | 1,9 | –15,2 | –31,9 |
| Natural rubber | 370,7 | 0,3 | –18,0 | –32,7 |
| Hides | 105,4 | 0,0 | 0,1 | –1,4 |
| Wood pulp | 123,8 | –0,9 | –0,2 | –16,1 |
| Tropical wood | 141,8 | –0,6 | –4,3 | –11,0 |
| Sawn softwood | 114,3 | –1,9 | 4,9 | 16,3 |
| Minerals | 290,8 | –1,1 | –9,3 | –24,1 |
| Iron ore | 1027,6 | –5,0 | –13,3 | –26,0 |
| Non-ferrous metals | 220,7 | 0,0 | –8,4 | –24,7 |
| Precious metals | 393,3 | –1,2 | –8,0 | –14,5 |
| All commodities | 242,1 | 2,2 | –2,6 | –13,7 |
- Source : INSEE
graphiqueG_petrole_ang – Oil
- Source : INSEE
graphiqueG_alim_ang – Food
- Source : INSEE
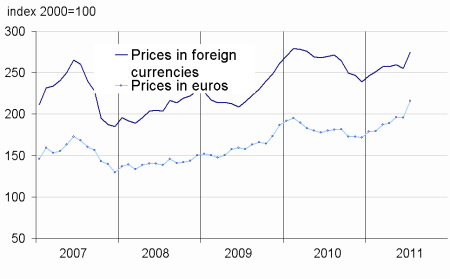
graphiqueG_ensemble_ang – All commodities
- Source : INSEE
graphiqueG_indus_ang – Industrial raw materials
- Source : INSEE
Pour en savoir plus
Time series : Raw materials prices
