


 12 April 2013
2013- n° 90In March 2013, oil prices declined Prices of oil and raw material imports - March 2013
12 April 2013
2013- n° 90In March 2013, oil prices declined Prices of oil and raw material imports - March 2013
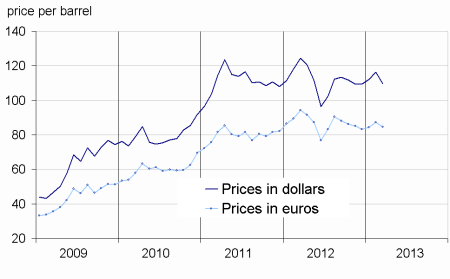
In March, the crude oil price in euro terms fell (-2.9% after +3.4% in February), reaching € 84.7 per barrel of Brent. In euro terms, the prices of commodities except energy imported into France remained stable (-0.2% after +0.1% in February).
In March, the crude oil price in euro terms fell (-2.9% after +3.4% in February), reaching € 84.7 per barrel of Brent. In euro terms, the prices of commodities except energy imported into France remained stable (-0.2% after +0.1% in February).
Oil prices stopped increasing
In March, the price of crude oil from the North Sea (Brent) in dollars fell sharply (-5.8% after +3.8%). It stood at $109.7 per barrel. In euros, the decline in the price of Brent was less marked (-2.9% after +3.4%), due to a depreciation of the euro against the dollar (-3.0%).
The prices of imported industrial raw material declined
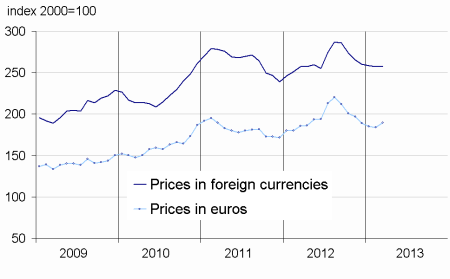
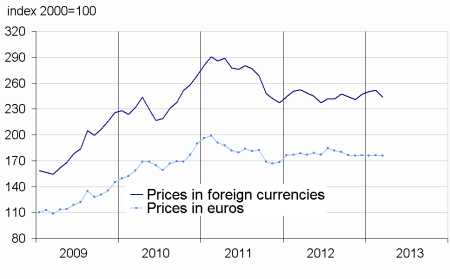
In March, prices of industrial raw materials in euro terms declined (-2.1% after +0.5%). In particular, prices of mineral raw materials decreased clearly (-3.8% after +0.7%). Prices of non-ferrous metals receded (-3.3% after +0.6%) due to persistent concerns regarding the vitality of European and Chinese demands. In particular, prices of copper (-2.1%), aluminum (–4.0%), lead (-5.3%) and zinc (-6.4%) declined. Prices of precious metals also declined, though less sharply than in February (-0.5% after –1.8%). The decrease affected mainly the prices of silver (-3.0%) and platinium (-2.5%), while prices of gold (+0.9%) and palladium (+3.8%) rose. The price of iron ore fell markedly, due to a decline in steel production in China (–6.8% after +2.3%).
On the other hand, prices of agricultural raw materials rebounded (+3.4% after -0.1%). Prices of sawn softwood (+9.1%) and wood pulp (+3.0%) increased significantly. In addition, the prices of natural textile fibers rose again (+7.5% after +3.9%), due to a higher cotton price (+8.5% after +4.5%) supported by an increase in Chinese demand.
The raw food materials prices rebounded
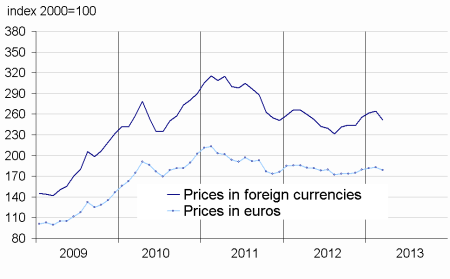
In March, prices of raw food materials in euro terms rose (+3.3% after -0.7%). Tropical foodstuff prices rose (+1.4% after –3.1%), notably those of coffee (+5.9% for the robusta and +1.1% for the arabica), due to a decline in production in Central America, a result of an epidemic affecting crops.
In addition, the prices of cocoa (+0.9%) tended to raise. Sugar prices also rose (+3.6%), due to bad weather conditions that have reduced significantly the production of Brazil, the largest producer and exporter of sugar. Beef prices (+9.7%) also increased sharply. Prices of cereals also rebounded (+3.1% after –0.7%) due to an increase in corn prices (+5.7%) which were driven down by the cold wave that hit part of Europe. Prices of oilseeds continued to rise (+1.5% after +1.6%), notably those of soybean meal (+2.5%) and soybean (+2.1%).
tableautabpetrole_ang – Oil and petroleum products
| Prices | Change (%) | |||
|---|---|---|---|---|
| over the last month | over the last 3 months | over the last 12 months | ||
| Brent in $ per barrel | 109.7 | –5.8 | 0.3 | –11.9 |
| Brent in € per barrel | 84.7 | –2.9 | 1.7 | –10.2 |
| Gasoline €/L | 0.59 | –2.2 | 7.8 | –6.4 |
| Gas Oil | 705.4 | –5.5 | 0.0 | –9.1 |
| Heavy fuel | 479.2 | –4.1 | 4.1 | –16.4 |
| Naphtha | 701.8 | –4.9 | –2.2 | –13.0 |
- Prices are in euros per tonne unless otherwise specified
- Source : INSEE
tableautabmatprem_ang – Imported raw materials (excluding energy) in euros
| Index | Changes (%) | |||
|---|---|---|---|---|
| over the last month | over the last 3 months | over the last 12 months | ||
| Food total | 189.7 | 3.3 | 0.3 | 2.2 |
| Tropical foodstuff | 145.5 | 1.4 | –5.6 | –10.2 |
| Oil seeds. vegetable oils | 242.5 | 1.5 | –0.5 | 14.0 |
| Cereals | 216.7 | 3.1 | 1.8 | 4.7 |
| Sugar | 158.2 | 3.6 | –3.4 | –24.5 |
| Beef meat | 125.6 | 9.7 | 11.3 | 3.4 |
| Industrial raw materials | 178.8 | –2.1 | –0.6 | –3.7 |
| Agricultural raw materials | 114.8 | 3.4 | 3.6 | 6.9 |
| Natural Fibers | 138.5 | 7.5 | 13.2 | –4.1 |
| Natural rubber | 307.0 | –4.9 | –1.6 | –23.5 |
| Hides | 84.3 | –1.8 | 1.9 | 16.2 |
| Wood pulp | 87.4 | 3.0 | 4.5 | 1.5 |
| Tropical wood | 97.0 | 0.5 | –5.4 | –5.4 |
| Sawn softwood | 112.4 | 9.1 | 10.3 | 46.5 |
| Minerals | 213.9 | –3.8 | –1.8 | –6.8 |
| Iron ore | 799.4 | –6.8 | 10.0 | –1.4 |
| Non-ferrous metals | 159.8 | –3.3 | –4.4 | –8.6 |
| Precious metals | 292.7 | –0.5 | –4.1 | –4.5 |
| All commodities | 175.7 | –0.2 | –0.3 | –1.6 |
- Source : INSEE
graphiqueG_petrole_ang – Oil
- Source : INSEE
graphiqueG_alim_ang – Food
- Source : INSEE
graphiqueG_ensemble_ang – All commodities
- Source : INSEE
graphiqueG_indus_ang – Industrial raw materials
- Source : INSEE
Pour en savoir plus
Time series : Raw materials prices
