


 1 December 2011
2011- n° 297In September 2011, the turnover fell in personal services and in the retail trade Sales volume in the retail trade and personal services - September 2011
1 December 2011
2011- n° 297In September 2011, the turnover fell in personal services and in the retail trade Sales volume in the retail trade and personal services - September 2011
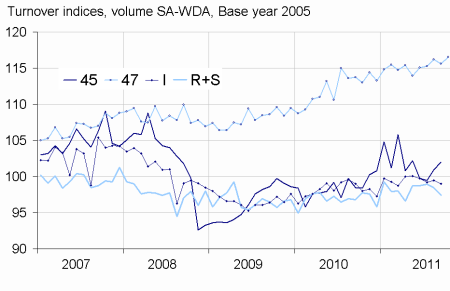
In September 2011, the turnover declined in household services (–1.1 %), in accommodation and food services (–0.5 %) and in the retail trade, except of motor vehicles and motorcycles (–0.5 %). It grew in the trade and repair of motor vehicles and motorcycles (+1.1 %).

Every index in this issue is in volume, seasonally and working-day adjusted.
In September 2011, the turnover declined in household services (–1.1 %), in accommodation and food services (–0.5 %) and in the retail trade, except of motor vehicles and motorcycles (–0.5 %). It grew in the trade and repair of motor vehicles and motorcycles (+1.1 %).
Compared to Q2 2011 (q-o-q), the turnover of Q3 2011 grew in the retail trade (+0.8 %) and in household services (+0.3 %). It decreased in accommodation and food service activities (–0.7 %) whereas it was broadly stable in the trade and repair of motor vehicles and motorcycles (–0.1 %).
Compared to Q3 2010 (y-o-y), the turnover of Q3 2011 expanded in the trade and repair of motor vehicles and motorcycles (+2.4 %), in households services (+1.6 %) and in the retail trade (+1.4 %). Conversely, it was steady in accommodation and food services activities (+0.0 %).
According to our estimate, the turnover in the retail trade is expected to rise in October 2011 (+0.7 %).
graphiqueGraph1_Anglais – Retail trade and personal services
- Source : INSEE
Please note that the « retail trade… » chart (47) includes the early estimate for October 2011.
Revisions
The SA-WDA evolution in August has been revised by –0.5 point in the trade and repair of motor vehicles and motorcycles. The variation, initially announced at +1.9 %, has been corrected at +1.4 %. In the same period, the SA-WDA evolution has been revised by –0.4 point in the retail trade, by –0.4 point in household services and by –0.4 point in accommodation and food service activities.
tableauTableau 1 – Monthly turnover indices
| Change in % | |||||
|---|---|---|---|---|---|
| Classification NAF rev. 2 | Weight | Sept./ Aug. | Aug./ July | q-o-q (1) | y-o-y (2) |
| 45 Trade and repair of motor vehicles and motorcycles | 1000 | 1.1 | 1.4 | –0.1 | 2.4 |
| 47 Retail trade, except of motor vehicles and motorcycles | 1000 | –0.5 | 0.8 | 0.8 | 1.4 |
| 471 Retail sale in non-specialized stores | 415 | 0.1 | 1.4 | –0.8 | –0.3 |
| 472 to 477 Retail sale in specialized stores | 545 | –1.0 | 0.4 | 1.8 | 2.5 |
| 478 and 479 Retail trade not in stores | 40 | –0.4 | 2.3 | 1.0 | 1.0 |
| I Accommodation and food service activities | 1000 | –0.5 | 0.3 | –0.7 | 0.0 |
| R+S Households services | 1000 | –1.1 | –0.4 | 0.3 | 1.6 |
| R Arts, entertainment and recreation | 472 | –1.5 | –1.6 | 0.2 | 3.4 |
| S Other service activities | 528 | –0.8 | 0.8 | 0.2 | –0.2 |
- (1) Quarter-on-quarter: last three months / three previous months.
- (2) Year-on-year: last three months / three same months of the previous year.
- The codes correspond to differents levels of aggregation of the classification NAF rev.2.
- Source: INSEE
tableauTableau 2 – Turnover indices: early estimate*
| Change in % | ||
|---|---|---|
| Oct. 2011/ Sept. 2011 | Oct. 2011/ Oct. 2010 | |
| 47 Retail trade… | 0.7 | 3.1 |
- * Econometric estimate from a set of sources available within 30 days after the end of the reference month
- Source: INSEE
Documentation
Methodology (pdf,121 Ko)
Pour en savoir plus
