


 31 May 2012
2012- n° 133In April, households’ consumption in goods is dynamic anew (+0.6%) Household consumption expenditure on goods - April 2012
31 May 2012
2012- n° 133In April, households’ consumption in goods is dynamic anew (+0.6%) Household consumption expenditure on goods - April 2012
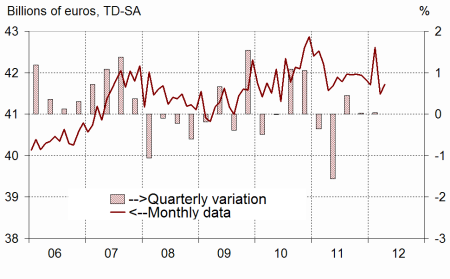
In April, households’ expenditure in goods increased by 0.6% in volume*, after having decreased by 2.6% in March. This slight bouncing is attributable to that of expenditure in energy products. On the other hand, purchases in clothing markedly decreased.
In April, households’ expenditure in goods increased by 0.6% in volume*, after having decreased by 2.6% in March. This slight bouncing is attributable to that of expenditure in energy products. On the other hand, purchases in clothing markedly decreased.
Engineered goods : decreasing
Durables: slightly decreasing
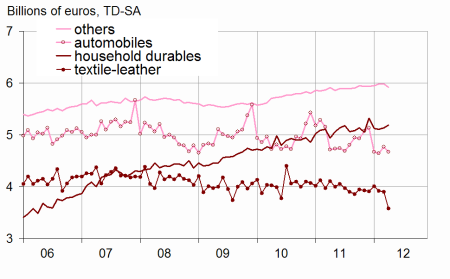
Households’ expenditure in durables decreased in April (-0.6%, after +1.9% in March), notably because of a decrease in car purchases (–2.0% in April after +2.8%) imputable to the new market. Conversely, purchases in household durables kept increasing (+1.1% after +0.6%).
Textile-leather: sharply decreasing
Consumption of textile and leather markedly declined in April (-8.2% after -0.3% in March) and reached its lowest level since January 2002. The rainy weather could have been unfavourable to purchases in spring-summer clothing.
Other engineered goods: decreasing
Consumption expenditure in other engineered goods decreased in April (-1.0% after +0.1% in March), notably those in hardware.
[* Volumes are chained and all figures are trading days and seasonally adjusted.]
graphiquegraph1_new_ang – Total consumption of goods
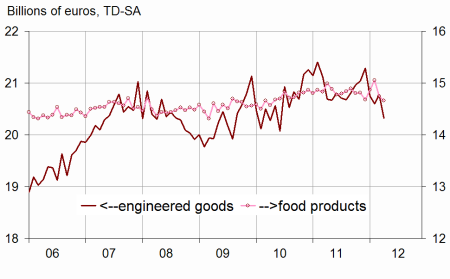
graphiquegraph2_new_ang – Food and engineered goods
graphiquegraph3_new_ang – Decomposition of engineered goods
Food products: slightly decreasing
After a strong start in 2012, followed by a decrease in March (–2.1%), consumption in food products decreased anew in April (-0.5%).
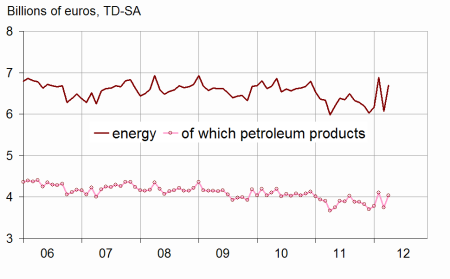
Energy: new bouncing
After a sharp increase in February (+11.5%) and the following decrease in March (–11.8%), households’ consumption in energy products markedly bounced anew in April (+10.2%): cold temperatures in April notably drove heating purchases up (electricity, gas, fuel).
Revisions a bit larger than usually
The evolutions of previous months have been revised to a larger extent than during previous releases, but this revision magnitude is typical of this period of the year. In March, the decrease of household consumption in goods is thus estimated at –2.6%, instead of -2.9% previously. Revisions notably come from the benchmarking on reviewed annual account, from the reestimation of calendar and seasonal adjustment models, and also from the integration of new indicators. In particular, sources concerning textile and leather consumption have also been changed by integrating monthly information from the Institut français de la mode (IFM), in order to get closer to the methodology used for the corresponding annual account.
tableautab1_eng – Households consumption expenditures in goods
| Févr. | Mars | Avril | Avr.12/ | |
|---|---|---|---|---|
| 2012 | 2012 | 2012 | Avr.11 | |
| Food products | 15.051 | 14.739 | 14.658 | |
| Change (%) | 1.2 | –2.1 | –0.5 | –2.2 |
| Engineered goods | 20.597 | 20.780 | 20.323 | |
| change (%) | –0.7 | 0.9 | –2.2 | –1.8 |
| Of which: | ||||
| Automobiles | 4.642 | 4.771 | 4.673 | |
| Change (%) | –0.7 | 2.8 | –2.0 | –1.0 |
| Household durables | 5.104 | 5.133 | 5.192 | |
| Change (%) | –0.5 | 0.6 | 1.1 | 5.1 |
| Textile-leather | 3.915 | 3.903 | 3.583 | |
| Change (%) | –2.2 | –0.3 | –8.2 | –12.8 |
| Other engineered goods | 5.978 | 5.982 | 5.920 | |
| Change (%) | 0.5 | 0.1 | –1.0 | 0.1 |
| Energy | 6.883 | 6.074 | 6.693 | |
| Change (%) | 11.5 | –11.8 | 10.2 | 12.0 |
| Including petroleum products | 4.109 | 3.753 | 4.041 | |
| Change (%) | 8.7 | –8.7 | 7.7 | 10.1 |
| Total | 42.606 | 41.481 | 41.722 | |
| Change (%) | 2.2 | –2.6 | 0.6 | 0.4 |
| Manufactured goods | 36,403 | 36.208 | 35.747 | |
| Change (%) | 0.5 | –0.5 | –1.3 | –1.6 |
graphiquegraph4_new_ang – Energy
Documentation
Methodology (pdf,23 Ko)
Pour en savoir plus
