


 31 January 2013
2013- n° 27Overall producer prices of agricultural products slid in December Indices of agricultural prices - December 2012
31 January 2013
2013- n° 27Overall producer prices of agricultural products slid in December Indices of agricultural prices - December 2012
In December, overall producer prices of agricul-tural products dipped (-0.6 % compared to November) ; over one year they rose by 14.1 %.
In December, overall producer prices of agricultural products dipped (-0.6 % compared to November) ; over one year they rose by 14.1 %.
Cereal prices slightly decreased in December (-3.2 %), as a result of ample sales, made by different operators willing to benefit from current levels of prices.
graphiquecereal – Producer price of cereals

Oleaginous prices did not change much this month (–0.4 %), remaining at a high level. The worldwide rape crop, which is the main oleaginous grain grown in France, was also forecast to decrease slightly this season.
Potato prices doubled in December compared to the same month last year (+119.8 %), due to a marked shortfall of supply in North-Western Europe. The bad weather in August spoiled practically a fifth of the crop in England and led as well to a substantial deficit of production in the Netherlands and in Belgium. The dry weather in France during September decreased the yields.
Prices of quality wines increased in December (+2.1 %). Prices of other wines surged by more than 20 % over three months: yields tumbled due to bad weather.
Price of fresh fruits went up strongly in December year-over-year (+39.5 %). Prices of apple and pear were particularly affected, rising respectively by 56 % and 47 %, due to a strong decrease in production in Europe.
graphiquevegetable – Producer price of fresh vegetables
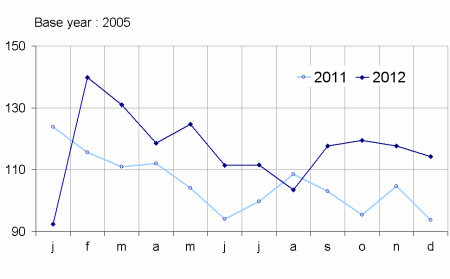
Prices of fresh vegetables increased year-over-year (+21.9 %). Salad production was slowed by chilly weather. On the demand side, the domestic consumption was sustained for leeks, carrots and chicories.
graphiquepig – Producer prices of pigs ans big cattle
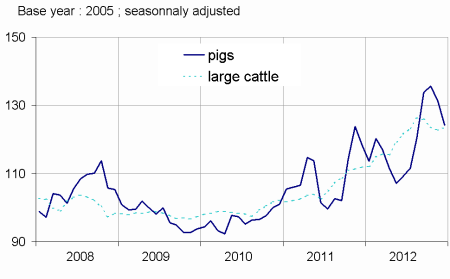
On a seasonally adjusted basis, price of animals weakened in December (-0.9 %). Pig prices (-5.5 %) fell back for the second month in a row : the North-American competition kept on driving down European exportations in the beginning of this month while the domestic demand remained sluggish. Egg prices continued to rise in December (+5.4 %). The European supply was low due to a delay in the implementation of new sanitary standards in some neighbouring countries. The price also reflected the cost of investments agreed and the increase in intermediate consumption (cereals).
tableauTab1 – Indices of producer prices of agricultural products (IPPAP)
| Variation as % over | |||||
|---|---|---|---|---|---|
| weights | Dec 2012 | a month | 3 months | a year | |
| raw | seasonally adjusted data | raw | |||
| Agricultural goods output | 1000 | 142.8 | –0.6 | +1.9 | +14.1 |
| excluding fruits and vegetables | 878 | 145.2 | –0.6 | +1.8 | +12.9 |
| Crop output (excluding fruits and vegetables) | 417 | 169.9 | –0.9 | +2.2 | +21.5 |
| Cereals | 115 | 241.2 | –3.2 | –1.2 | +35.5 |
| of which soft wheat | 63 | 258.2 | –3.5 | –0.9 | +44.2 |
| grain maize | 27 | 218.8 | –2.6 | –0.5 | +33.6 |
| Potatoes | 19 | 240.4 | /// | /// | +119.8 |
| Wines | 161 | 129.7 | +2.1 | +8.5 | +7.3 |
| quality wines | 140 | 126.9 | +1.8 | +6.2 | +6.2 |
| other wines | 21 | 147.1 | +4.1 | +22.5 | +14.0 |
| Oleaginous | 28 | 219.2 | –0.4 | –6.8 | +14.5 |
| Horticultural products | 51 | 127.2 | +0.5 | +4.5 | +3.8 |
| Other crop products | 43 | 115.6 | +0.1 | –1.0 | +6.0 |
| Fruits and vegetables (1) | 122 | 125.4 | /// | /// | +24.8 |
| Fresh vegetables | 61 | 114.2 | /// | /// | +21.9 |
| Fresh fruits | 39 | 154.1 | /// | /// | +39.5 |
| Animal output | 461 | 122.9 | –0.3 | +1.4 | +3.8 |
| Animals | 286 | 126.0 | –0.9 | –1.6 | +7.4 |
| of which large cattle | 108 | 123.3 | +0.7 | –1.9 | +10.4 |
| calves | 29 | 121.8 | +0.4 | +2.1 | +1.4 |
| pigs | 64 | 117.1 | –5.5 | –7.2 | +5.3 |
| sheep | 14 | 121.6 | –3.0 | –6.0 | –1.2 |
| poultry | 59 | 147.1 | +0.4 | +2.3 | +9.7 |
| of which chicken | 26 | 148.0 | +0.7 | +1.4 | +11.3 |
| Milk | 159 | 107.5 | 0.0 | +5.1 | –4.4 |
| of which cow milk (2) | 148 | 106.9 | 0.0 | +5.5 | –4.7 |
| Eggs | 13 | 246.5 | +5.4 | +17.4 | +13.4 |
- (1) Including vegetables for industry.
- (2) The price for December is not yet known and therefore is estimated by carrying forward the seasonally adjusted price from November
- Sources: INSEE - SSP (Ministry of Agriculture)
Purchase price of the means of agricultural production remained stable in December
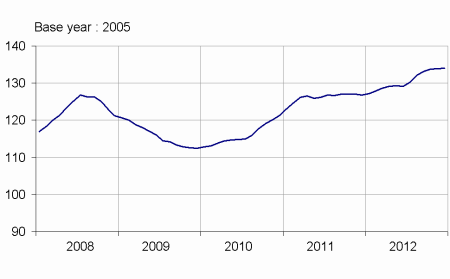
The prices of intermediate consumptions stabilised in December (+0.1 %). Over one year, prices of animal feed rose by more than 20 %. Investment prices increased slightly (+0.2 %), material for cultivation being more expensive in December.
graphiquemeans – Purchase price of the means of agricultural production
tableauTab2 – Indices of purchase prices of the means of agricultural production (IPAMPA)
| weights | Dec 2012 | Variation as % over | |||
|---|---|---|---|---|---|
| a month | 3 month | a year | |||
| Total input | 1000 | 134.1 | +0.1 | +0.7 | +5.7 |
| Goods and services currently consumed in agriculture | 758 | 138.4 | +0.1 | +0.8 | +7.0 |
| Energy (1) | 84 | 152.8 | –1.1 | –2.2 | +3.1 |
| Seeds | 51 | 119.8 | +0.4 | +1.7 | +3.9 |
| Fertilisers and soil improvers | 92 | 167.7 | +0.1 | +0.3 | +1.2 |
| Plant protection products | 77 | 105.8 | –0.7 | –0.5 | +0.6 |
| Animal feed | 189 | 164.7 | +0.4 | +2.9 | +21.7 |
| Veterinary expenses | 38 | 119.0 | +0.2 | +0.4 | +3.0 |
| Small equipment and tools | 14 | 113.7 | +0.7 | +1.4 | +0.4 |
| Maintenance of materials | 56 | 130.9 | +0.1 | +0.4 | +3.5 |
| Maintenance of buildings | 9 | 124.2 | 0.0 | 0.0 | +1.4 |
| Other goods and services | 149 | 113.1 | +0.5 | +0.4 | +0.5 |
| Goods and services contributing to investment | 242 | 120.5 | +0.2 | +0.2 | +1.3 |
| Material | 170 | 118.0 | +0.3 | +0.3 | +1.7 |
| Tractors | 71 | 113.6 | 0.0 | –0.4 | +0.5 |
| Machinery and plant for cultivation | 36 | 122.1 | +1.5 | +1.8 | +3.0 |
| Machinery and plant for harvesting | 37 | 118.9 | –0.2 | +0.4 | +2.4 |
| Utility vehicles | 16 | 114.4 | +0.5 | +0.5 | +1.4 |
| Buildings | 72 | 126.5 | 0.0 | 0.0 | +0.5 |
- (1) The repayment of 5 cents per litre of fuel of the domestic tax on energy products (TICPE) benefiting farmers has been applied in advance for the year 2012
- Sources : INSEE - SSP (Ministry of Agriculture)
Documentation
Methodology (pdf,122 Ko)
Pour en savoir plus
Time series : Indices of agricultural prices
