


 30 November 2011
2011- n° 290In October, households’ consumption in goods is stable Household consumption expenditure on goods - October 2011
30 November 2011
2011- n° 290In October, households’ consumption in goods is stable Household consumption expenditure on goods - October 2011
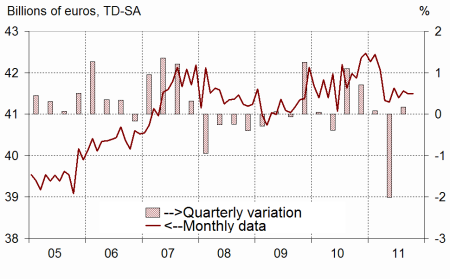
In October, households’ expenditure in goods were stable in volume*, after having increased by 0.2% in September. On the one hand, consumption of textile and leather bounced. But on the other hand, expenditure in energy products and car purchases decreased.
In October, households’ expenditure in goods were stable in volume*, after having increased by 0.2% in September. On the one hand, consumption of textile and leather bounced. But on the other hand, expenditure in energy products and car purchases decreased.
[* Volumes are chained and all figures are trading days and seasonally adjusted.]
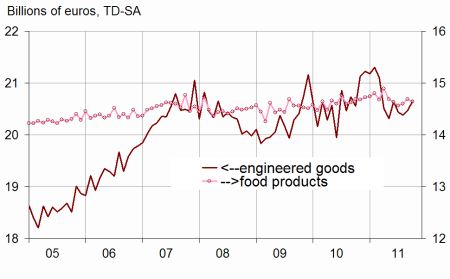
Engineered goods : increasing
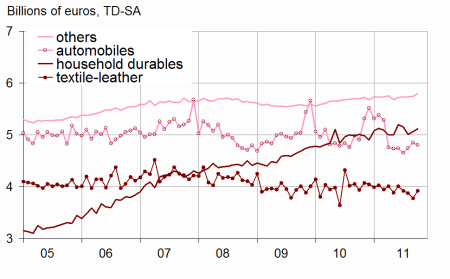
Durables : slightly decreasing
Households’ expenditure in durables slightly decreased in October (–0.2%), after the increase in September(+1.7%). This is due to car purchases which declined on the new and second hand markets (–1.0% after +2.3% in September). This decrease is partly offset by the increase of expenditure in household durables.
Textile-leather : sharply increasing
Purchases in textile and leather bounced in October (+3.8%) after a decrease during the summer (–0.9% in August and –2.6% in September).
Other engineered goods : increasing
Consumption expenditure in other engineered goods accelerated in October (+0.9%, after +0.2% in September), notably expenditure in hardware.
graphiquegraph1_new_ang – Total consumption of goods
graphiquegraph2_new_ang – Food and engineered goods
graphiquegraph3_new_ang – Decomposition of engineered goods
Food products : slightly decreasing
Consumption in food products slightly decreased in October (–0.3% after +0.6% in September), notably the one in tobacco. Indeed, a price increase in October had led households to anticipate their purchases in September.
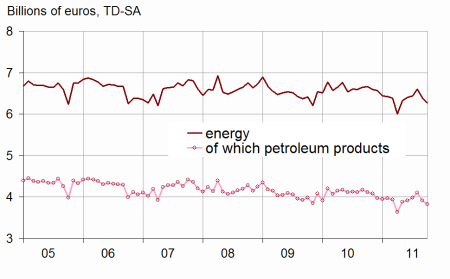
Energy : decreasing
Consumption of energy products decreased again in October (–2.0% after –3.1% in September), because of mild temperatures in comparison with normal seasonal levels.
The decrease of household consumption in goods in September is revised to –0.2% instead of –0.5%.
The decrease of household consumption in goods is now estimated at –0.2% in September, instead of –0.5%.
This revision is notably due to the integration of new information concerning expenditure in energy products, as well as the revision of seasonality linked to the new processing of sales in textile and leather prices.
tableautab1_eng – Households consumption expenditures in goods
| Août | Sept. | Oct. | Oct.11/ | |
|---|---|---|---|---|
| 2011 | 2011 | 2011 | Oct.10 | |
| Food products | 14.599 | 14.684 | 14.643 | |
| Change (%) | 0.2 | 0.6 | –0.3 | –0.3 |
| Engineered goods | 20.383 | 20.461 | 20.652 | |
| change (%) | –0.3 | 0.4 | 0.9 | 0.5 |
| Of which: | ||||
| Automobiles | 4.738 | 4.849 | 4.800 | |
| Change (%) | 1.8 | 2.3 | –1.0 | –2.0 |
| Household durables | 5.007 | 5.064 | 5.120 | |
| Change (%) | –2.8 | 1.2 | 1.1 | 2.2 |
| Textile-leather | 3.879 | 3.777 | 3.921 | |
| Change (%) | –0.9 | –2.6 | 3.8 | –0.3 |
| Other engineered goods | 5.730 | 5.745 | 5.798 | |
| Change (%) | –0.1 | 0.2 | 0.9 | 1.8 |
| Energy | 6.601 | 6.394 | 6.269 | |
| Change (%) | 2.6 | –3.1 | –2.0 | –5.9 |
| Including petroleum products | 4.100 | 3.915 | 3.828 | |
| Change (%) | 2.8 | –4.5 | –2.2 | –6.9 |
| Total | 41.561 | 41.493 | 41.489 | |
| Change (%) | 0.4 | –0.2 | 0.0 | –0.9 |
| Manufactured goods | 35.988 | 36.019 | 36.127 | |
| Change (%) | 0.3 | 0.1 | 0.3 | –0.2 |
graphiquegraph4_new_ang – Energy
Documentation
Methodology (pdf,23 Ko)
Pour en savoir plus
