


 29 August 2012
2012- n° 211In August 2012, the economic climate remains deteriorated in services Monthly survey of services - August 2012
29 August 2012
2012- n° 211In August 2012, the economic climate remains deteriorated in services Monthly survey of services - August 2012
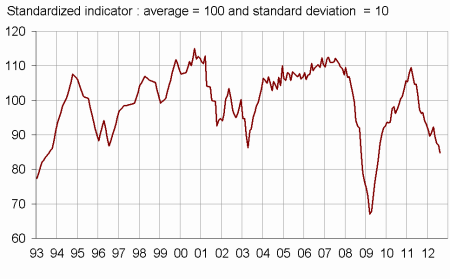
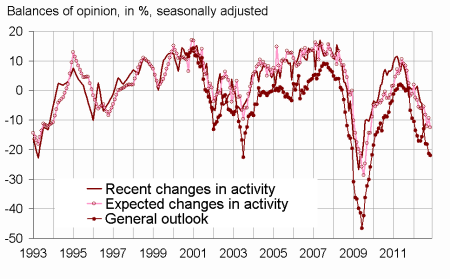
According to the business leaders surveyed in August 2012, the economic situation in services continues to deteriorate. The business climate synthetic indicator drops by two points compared with July and is 85. He remains below its long-term average. The turning point indicator indicates an unfavourable economic situation. The business leaders consider that activity is very de-graded in the recent period, and revise downward their expectations of activity for the months to come. The general outlook remains below its long-term average.

Warning: This publication marks a significant innovation. Now Insee publishes the results of surveys for the month of August.
According to the business leaders surveyed in August 2012, the economic situation in services continues to deteriorate. The business climate synthetic indicator drops by two points compared with July and is 85. He remains below its long-term average. The turning point indicator indicates an unfavourable economic situation. The business leaders consider that activity is very de-graded in the recent period, and revise downward their expectations of activity for the months to come. The general outlook remains below its long-term average.
graphiqueGraph1 – Business climate synthetic indicator
graphiquegraph_retourn – Turning point indicator
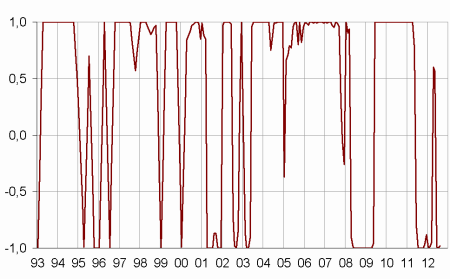
- Note: close to 1 (respectively -1), this indicator indicates a favourable short-term economic situation (respectively unfavourable).
graphiqueGraph2 – Activity
tableauTable_quarter – Economic outlook in the services sector
| Average* | May 12 | June 12 | July 12 | Aug. 12 | |
|---|---|---|---|---|---|
| Business climate synthetic indicator | 100 | 90 | 87 | 87 | 85 |
| General outlook | –6 | –18 | –18 | –21 | –22 |
| Past activity | 4 | –4 | –4 | –13 | –11 |
| Expected activity | 3 | –8 | –12 | –9 | –13 |
| Expected demand | 1 | –9 | –11 | –9 | –15 |
| Business situation | 0 | –13 | –15 | –16 | –15 |
| Past selling prices | –2 | –4 | –5 | –7 | –8 |
| Expected selling prices | –1 | –6 | –6 | –5 | –7 |
| Past employment | 3 | –2 | –14 | –16 | –2 |
| except temporary work agencies | 1 | 0 | –6 | –6 | –4 |
| Expected employment | 3 | –12 | –10 | –4 | –8 |
| except temporary work agencies | 0 | –7 | –7 | –8 | –6 |
| Investments | |||||
| Past investments | 2 | 0 | 3 | –6 | –8 |
| Expected investments | 1 | –3 | –5 | –7 | –7 |
- * Average of the balances of opinion since 1988
- Source: Insee
Documentation
Methodology (2016) (pdf,158 Ko)
Pour en savoir plus
Time series : Economic outlook surveys – Services
