


 7 June 2012
2012- n° 142New unemployment rate increase in Q1 2012 ILO Unemployment and Labour Market-related indicators (Labour Force Survey results)
- 1st Quarter 2012
7 June 2012
2012- n° 142New unemployment rate increase in Q1 2012 ILO Unemployment and Labour Market-related indicators (Labour Force Survey results)
- 1st Quarter 2012
In Q1 2012, the average ILO unemployment rate in metropolitan France and overseas departments stood at 10.0% of the active population.
The unemployment rate
The unemployment rate increased by 0.3 point in Q1 2012 in metropolitan France
In Q1 2012, the average ILO unemployment rate in metropolitan France and overseas departments stood at 10.0% of the active population.
In metropolitan France only, with 2.7 million unemployed people, 9.6% of the active population was unemployed, as well for men and women. The unemployment rate increased by 0.3 point q-o-q after an increase of 0.1 in Q3 2011. It is as high as in 1999.
More generally, in metropolitan France, 3.5 million people did not work but would like to work, whether they are available or not for work within two weeks, or whether they look actively for a job or not (see additional indicators on the internet).
graphiquegraph_cho_nvIR – ILO-unemployment rate
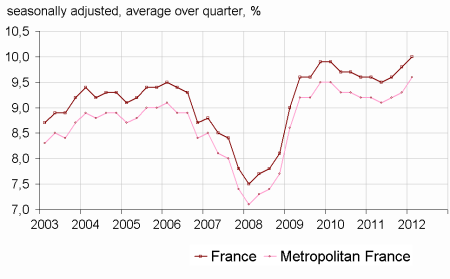
- Estimation close to +/-0.3 point of the unemployment rate Estimation close to +/-0.3 point of the quaterly variation of the unemployment rate France = Metropolitan France + overseas departments
- Covers the population of people living in households, people aged 15 years or more
- Source: INSEE, Labour Force Survey
tableautab_cho_nvIR – Ilo-unemployment rate in metropolitan France
| ILO-unemployment rate (%) | Variation in point | Thousands | |||
|---|---|---|---|---|---|
| 2011Q4 | 2012Q1 (p)* | over quarter | over year | 2012Q1 (p)* | |
| Total | 9,3 | 9,6 | 0,3 | 0,4 | 2 746 |
| 15-24 years | 22,3 | 22,5 | 0,2 | –0,2 | 630 |
| 25-49 years | 8,6 | 8,9 | 0,3 | 0,7 | 1 619 |
| 50 years and more | 6,4 | 6,6 | 0,2 | 0,4 | 498 |
| Men | 9,1 | 9,6 | 0,5 | 1,0 | 1 436 |
| 15-24 years | 22,0 | 22,7 | 0,7 | 1,6 | 348 |
| 25-49 years | 8,1 | 8,7 | 0,6 | 1,1 | 821 |
| 50 years and more | 6,3 | 6,8 | 0,5 | 0,9 | 267 |
| Women | 9,6 | 9,6 | 0,0 | –0,2 | 1 310 |
| 15-24 years | 22,7 | 22,2 | –0,5 | –2,4 | 282 |
| 25-49 years | 9,0 | 9,2 | 0,2 | 0,3 | 798 |
| 50 years and more | 6,6 | 6,3 | –0,3 | –0,3 | 231 |
- *(p) = provisional results
- Covers the population of people living in households in metropolitan France, people aged 15 years or more
- Source: INSEE, Labour Force Survey
ILO employment and activity
The employment rate of the population aged 15-64 years decreased by 0.1 point in Q1 2012 and stood at 63.8%.
graphiquegraph_partpop_nvIR – Permanent and temporary contract employment rate (15-64 years)
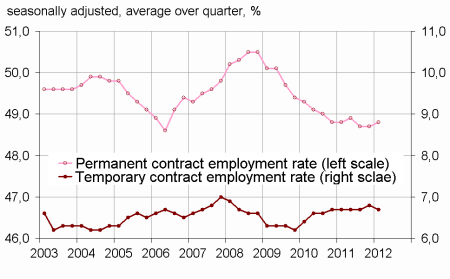
- Covers the population of people living in households, people aged 15-64 years
- Source: INSEE, Labour Force Survey
Permanent contracts increased by 0.1 point in Q1 2012, at 48.8% of the population aged 15-64. Temporary contracts are stable over the year, at 6.8%.
tableautab_partpop_nvIR – ILO employment, unemployment and activity in the population aged 15-64 years
| % of people in the age group | Variation in point | Thousands (1) | ||||
|---|---|---|---|---|---|---|
| 2011Q4 | 2012Q1 (p)* | Over quarter | Over year | 2012Q1 (p)* | ||
| Employed people (15-64 years) | 63,9 | 63,8 | –0,1 | –0,1 | 25 554 | |
| Full-time equivalent employment rate | 59,4 | 59,3 | –0,1 | –0,2 | 23 761 | |
| Men aged 15-64 | 67,9 | 67,8 | –0,1 | –0,5 | 13 342 | |
| Women aged 15-64 | 59,9 | 60,0 | 0,1 | 0,4 | 12 211 | |
| 15-24 years | 29,4 | 29,3 | –0,1 | –0,6 | 2 173 | |
| 25-49 years | 81,3 | 80,9 | –0,4 | –1,0 | 16 535 | |
| 50-64 years | 55,6 | 56,2 | 0,6 | 1,9 | 6 845 | |
| Included : 55-64 years | 42,8 | 43,5 | 0,7 | 3,0 | 3 487 | |
| Core employment rate of 55-64 years | 42,7 | 43,3 | 0,6 | 3,0 | ||
| Unemployed persons (15-64 years) | 6,6 | 6,8 | 0,2 | 0,3 | 2 739 | |
| Men aged 15-64 | 6,8 | 7,3 | 0,5 | 0,8 | 1 433 | |
| Women aged 15-64 | 6,4 | 6,4 | 0,0 | –0,1 | 1 306 | |
| 15-24 years | 8,4 | 8,5 | 0,1 | –0,3 | 630 | |
| 25-49 years | 7,6 | 7,9 | 0,3 | 0,5 | 1 619 | |
| 50-64 years | 3,9 | 4,0 | 0,1 | 0,3 | 490 | |
| Included : 55-64 years | 3,0 | 3,1 | 0,1 | 0,3 | 248 | |
| Active people (15-64 years) | 70,5 | 70,7 | 0,2 | 0,3 | 28 292 | |
| Men aged 15-64 | 74,7 | 75,1 | 0,4 | 0,4 | 14 775 | |
| Women aged 15-64 | 66,4 | 66,4 | 0,0 | 0,3 | 13 517 | |
| 15-24 years | 37,8 | 37,7 | –0,1 | –1,0 | 2 802 | |
| 25-49 years | 88,9 | 88,9 | 0,0 | –0,4 | 18 154 | |
| 50-64 years | 59,5 | 60,2 | 0,7 | 2,3 | 7 336 | |
| Included : 55-64 years | 45,7 | 46,6 | 0,9 | 3,3 | 3 735 | |
| Active life expectancy of 55-64 years (years) | 4,6 | 4,6 | 0,0 | 0,3 | ||
- *(p) = provisional results
- Covers the population of people living in households in metropolitan France, people aged 15 years or more
- (1) those data cover the people who are 15-64 years old. They are a little bit different of the data in table 1 (which covers the total population).
- Source: INSEE, Labour Force Survey
The full time equivalent employment rate was lower by 4 points than the employment rate: it stood at 59.3% on average in Q1 2012.
The activity rate of the 15-64 years increased by 0.2 point, at 70.7%.
Slack work is stable
In Q1 2012, 5.2% of the persons employed were underemployed. Slack work increased by 0.2 point, at 0.4%.
The unwanted part-time was 4.8% of the employed (see additional indicators on the internet).
tableauTab_ssemp_nvIR – ILO underemployment
| ILO underemployment rate (%) | Variation in point | Thousands | |||
|---|---|---|---|---|---|
| 2011Q4 | 2012Q1 (p)* | Over a quarter | Over a year | 2012Q1 (p)* | |
| Total | 5,2 | 5,2 | 0,0 | 0,4 | 1 346 |
| Included : slack work | 0,2 | 0,4 | 0,2 | 0,2 | 98 |
| Women | 8,1 | 7,8 | –0,3 | 0,3 | 974 |
| Men | 2,7 | 2,7 | 0,0 | 0,6 | 372 |
- *(p) = provisional results
- Covers the population of people living in households in metropolitan France, people aged 15 years or more
- Source : INSEE, Labour Force Survey
Revision
The ILO unemployment rates of Q3 and Q4 2011 downgraded by 0,1 point with regard to the temporary publication. In this quarter, besides the usual revisions, the weighting of the labour force survey was revised to include the results of the census 2009.
Pour en savoir plus
