


 24 May 2013
2013- n° 121In may 2013, the business climate remains deteriorated in services Monthly survey of services - May 2013
24 May 2013
2013- n° 121In may 2013, the business climate remains deteriorated in services Monthly survey of services - May 2013
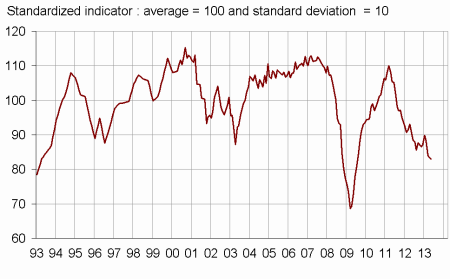
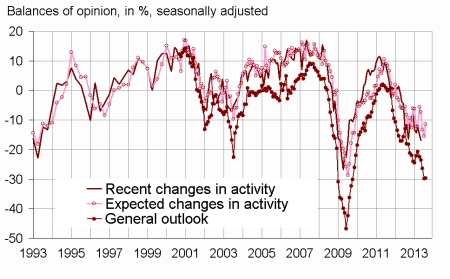
According to the business leaders surveyed in may 2013, the business climate in services remains deteriorated. The composite indicator is stable in may and is 83, well below its long-term average. Business leaders consider that activity has declined over the recent period. However, their business expectations for the coming months are less pessimistic. The general outlook remains well below its long-term average. The turning point indicator indicates an unfavorable economic situation’s dynamic.
According to the business leaders surveyed in may 2013, the business climate in services remains deteriorated. The composite indicator is stable in may and is 83, well below its long-term average. Business leaders consider that activity has declined over the recent period. However, their business expectations for the coming months are less pessimistic. The general outlook remains well below its long-term average. The turning point indicator indicates an unfavorable economic situation’s dynamic.
graphiqueGraph1 – Composite indicator
graphiquegraph_retourn – Turning point indicator
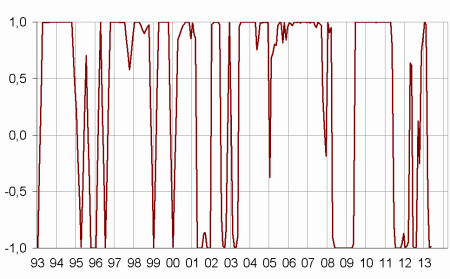
- Note: close to 1 (respectively -1), this indicator indicates a favourable short-term economic situation (respectively unfavourable).
graphiqueGraph2 – Activity
tableauTable_quarter – Economic outlook in the services sector
| Average* | Feb. 13 | March 13 | April 13 | May 13 | |
|---|---|---|---|---|---|
| Composite indicator | 100 | 88 | 84 | 83 | 83 |
| General outlook | –7 | –23 | –26 | –30 | –30 |
| Past activity | 3 | –14 | –13 | –15 | –17 |
| Expected activity | 3 | –7 | –13 | –15 | –11 |
| Expected demand | 0 | –11 | –16 | –16 | –18 |
| Business situation | –1 | –16 | –13 | –17 | –18 |
| Past selling prices | –3 | –14 | –14 | –14 | –11 |
| Expected selling prices | –1 | –13 | –13 | –11 | –12 |
| Past employment | 3 | –12 | –11 | –13 | –8 |
| except temporary work agencies | 1 | –6 | –10 | –12 | –6 |
| Expected employment | 2 | –11 | –13 | –17 | –15 |
| except temporary work agencies | 0 | –10 | –10 | –12 | –14 |
| Investments | |||||
| Past investments | 2 | –6 | –4 | –7 | –3 |
| Expected investments | 1 | –4 | –5 | –4 | –5 |
- * Average of the balances of opinion since 1988
- Source: Insee
Documentation
Methodology (2016) (pdf,158 Ko)
Pour en savoir plus
Time series : Economic outlook surveys – Services
