


 17 May 2013
2013- n° 114Decrease in business start-ups in April 2013 Enterprise births - April 2013
17 May 2013
2013- n° 114Decrease in business start-ups in April 2013 Enterprise births - April 2013
In April 2013, the number of business start-ups decreased compared to March: -2% for business setting up (seasonally and working-day adjusted data) including self-managed enterprises; -1.2% if the number of self-managed enterprises is excluded.
Warning : Only business start-ups data excluding self-managed enterprises (SME) are seasonally adjusted. In order to get the total number of enterprise creation, the raw number of SME is added. The SME time series is too short to be properly deseasonalized.
In April 2013, the number of business start-ups decreased compared to March: -2% for business setting up (seasonally and working-day adjusted data) including self-managed enterprises; -1.2% if the number of self-managed enterprises is excluded.
-3.1% year-on-year (quarterly basis)
The amount of entries added up in the last quarter decreased compared to the same quarter one year before (-3.1%).
The sectors that most contributed to that decrease were household services, construction and business support activities.
-2.2% year-on-year (twelve months basis)
During the last twelve months, the number of business start-ups decreased by 2.2% year-on-year.
99,978 self-managed enterprises since the beginning of 2013
For the first four months of 2013, more than one out of two businesses set up were self-managed enterprises (99,978).
tableautab0 – Self-managed business set-ups
| Jan. 2013 | Feb. 2013 | March 2013 | April 2013 |
|---|---|---|---|
| 26 088 | 23 820 | 25 370 | 24 700 |
- Source: INSEE (Sirene)
tableautab1EN – Business set-ups by month
| Jan. 2013 | Feb. 2013 | March 2013 | April 2013 | |
|---|---|---|---|---|
| Excl. self-managed enterprises (sa-wda *) | 21 356 | 22 208 | 21 990 | 21 732 |
| Variation [m-o-m] % | 4.2 | 4.0 | -1.0 | -1.2 |
| Incl., in raw data, self-managed enterprises | 47 444 | 46 028 | 47 360 | 46 432 |
| Variation [m-o-m] % | 24.6 | -3.0 | 2.9 | -2.0 |
- * Seasonally and working-day adjusted data
- Source: INSEE (Sirene)
tableautab2EN – business start-ups by type
| Moving total % change* | Moving total | Moving total | ||
|---|---|---|---|---|
| over 3 months | over 12 months | January- April 2013 | January- April 2012 | |
| Total | -3.1 | -2.2 | 196 035 | 202 255 |
| Companies | -2.5 | -4.8 | 57 462 | 59 097 |
| Individual enterprises | -3.3 | -1.0 | 138 573 | 143 158 |
| Of which self-managed | -10.8 | -1.7 | 99 978 | 111 160 |
- * Total of business start-ups during the last 3 or 12 months compared with the same months a year earlier
- // = meaningless
- Source: INSEE (Sirene)
graphiqueGraph1EN – Business start-ups
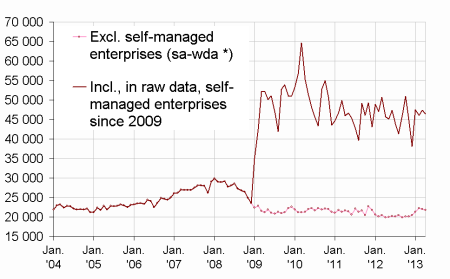
- * Seasonally and working-day adjusted data
- Source: INSEE (Sirene)
Pour en savoir plus
Time series : Business demography
